Ottawa Housing Market Sees Modest Sales Recovery as New Listings Slow in October
October Market Snapshot
Ottawa’s real estate market showed some signs of stabilisation in October, with a small increase in completed sales and a slowdown in new listings helping to improve the balance between buyers and sellers. Despite these changes, the market continued to favour buyers, with overall sales remaining below the levels recorded a year ago.
Average residential prices also experienced a slight decline, following several months of relative stability between July and September. However, the reduction in active inventory and months of supply, alongside an improved sales-to-new-listings ratio, offered some indication that market conditions may be beginning to settle.
While these developments provide a degree of encouragement for sellers, the improvement was partly driven by the typical seasonal reduction in new listings as the market moves towards winter.
Tami Eades, President of the Ottawa Real Estate Board (OREB), commented on the latest figures:
“October brought some welcome relief for sellers, with a modest increase in sales and fewer new listings helping to ease some of the pressure we’ve seen in recent months,” said Tami Eades, President of the Ottawa Real Estate Board (OREB).
“However, buyers continue to have considerable choice, and market conditions remain softer than a year ago. As we head into winter, employment uncertainty, borrowing costs, and housing policy will continue to influence buyer confidence and market activity. We’ll be watching closely to see whether October’s improvement carries through into the coming months.”
Ottawa Real Estate Sales and New Listing Trends
October saw 1,048 residential properties change hands through the MLS® System, representing a 10.7% decrease compared with the same month in 2025. However, transactions increased by 3.8% compared with September.
Looking at the previous 10 years, the September-to-October sales trend was evenly split, with five years recording an increase and five experiencing a decline. October’s result was within the usual historical range for this time of year, although it was still the third-lowest October sales total since 2016.
All three primary property categories experienced annual declines:
Single-family homes: 558 sales, down 12.5% year over year.
Townhouses: 350 sales, representing a 3.0% decrease.
Apartments: 115 sales, down 23.3%.
On the supply side, 2,382 new properties were brought to market during October. This was 1.2% fewer than October 2025 and 18.6% below September’s total.
Despite the monthly reduction, new listing activity remained historically elevated. October recorded the third-highest number of new listings for the month since 2016, sitting 26.1% above the previous 10-year average of 1,889.
Breaking the figures down by property type:
Single-family homes: 1,202 new listings, an increase of 1.3% from October 2025 but a 22.3% decrease from September. This was the second-highest October total since 2016.
Townhouses: 740 new listings, up 1.9% annually and down 11.8% month over month. This represented the highest October total recorded over the same period.
Apartments: 367 new listings, down 10.9% compared with last year and 18.1% from September. This was close to the previous 10-year October average of 362.
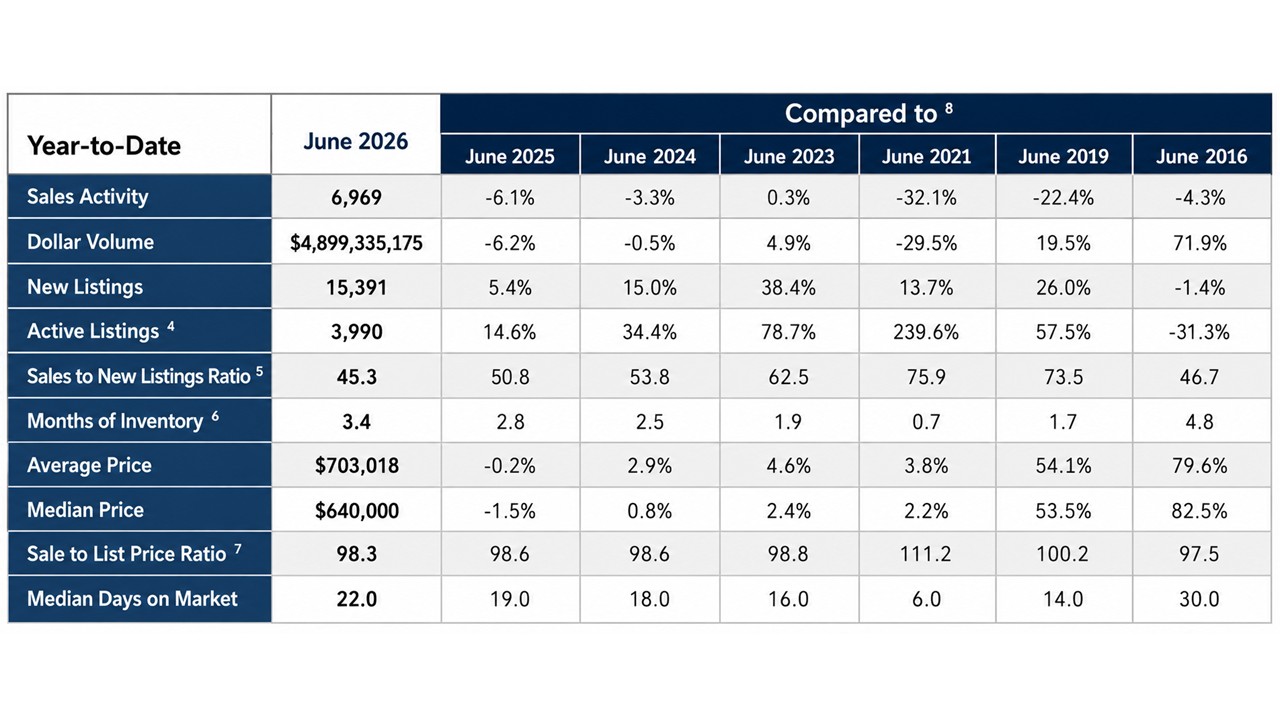
Looking at the broader picture, Ottawa recorded 11,335 residential sales between January and October 2026, a 7.3% decline compared with the same period last year. The combined dollar value of these transactions reached approximately $7.9 billion, down 8.0%.
Meanwhile, 25,352 new listings entered the market during the first 10 months of the year, representing a 3.4% increase year over year.
Home Prices, Inventory and Buyer-Seller Conditions
Residential property values continued to experience modest downward movement in October.
The average sale price across Ottawa was $678,512, down 4.5% from October 2025 and 1.0% compared with September. The median sale price also moved lower, reaching $622,000. This represented a 3.9% annual decline and a 0.5% decrease from the previous month.
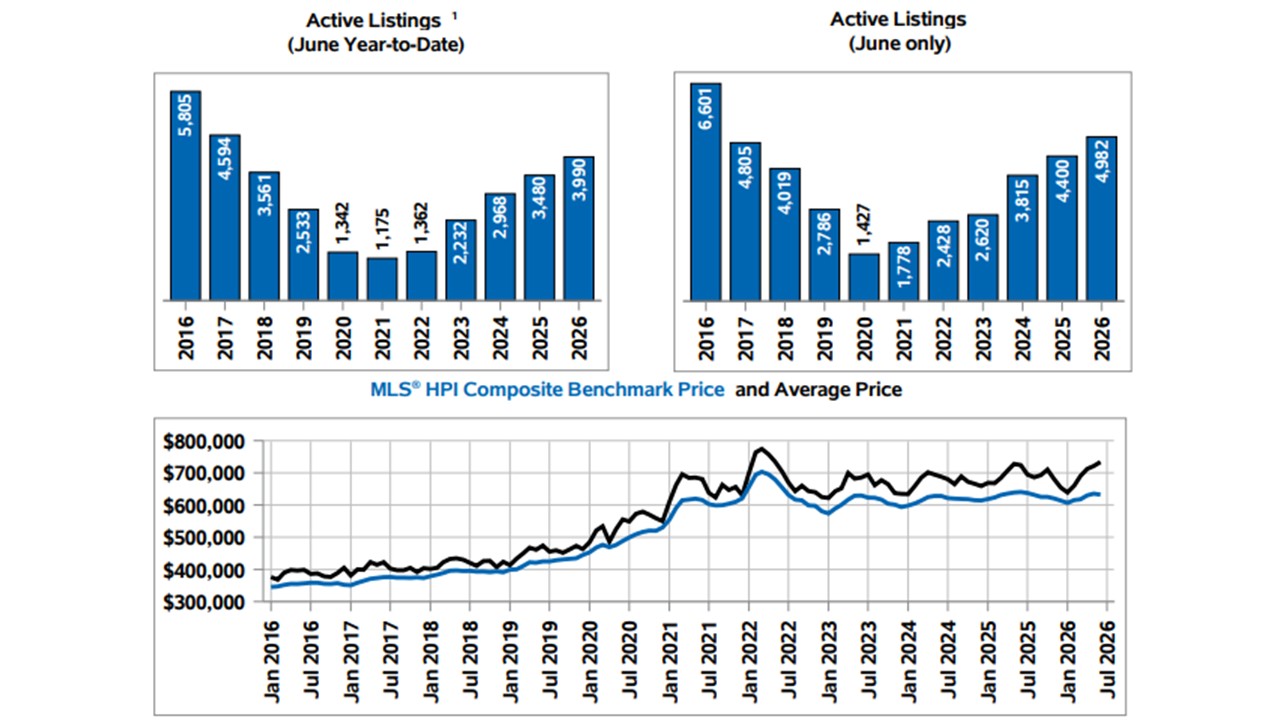
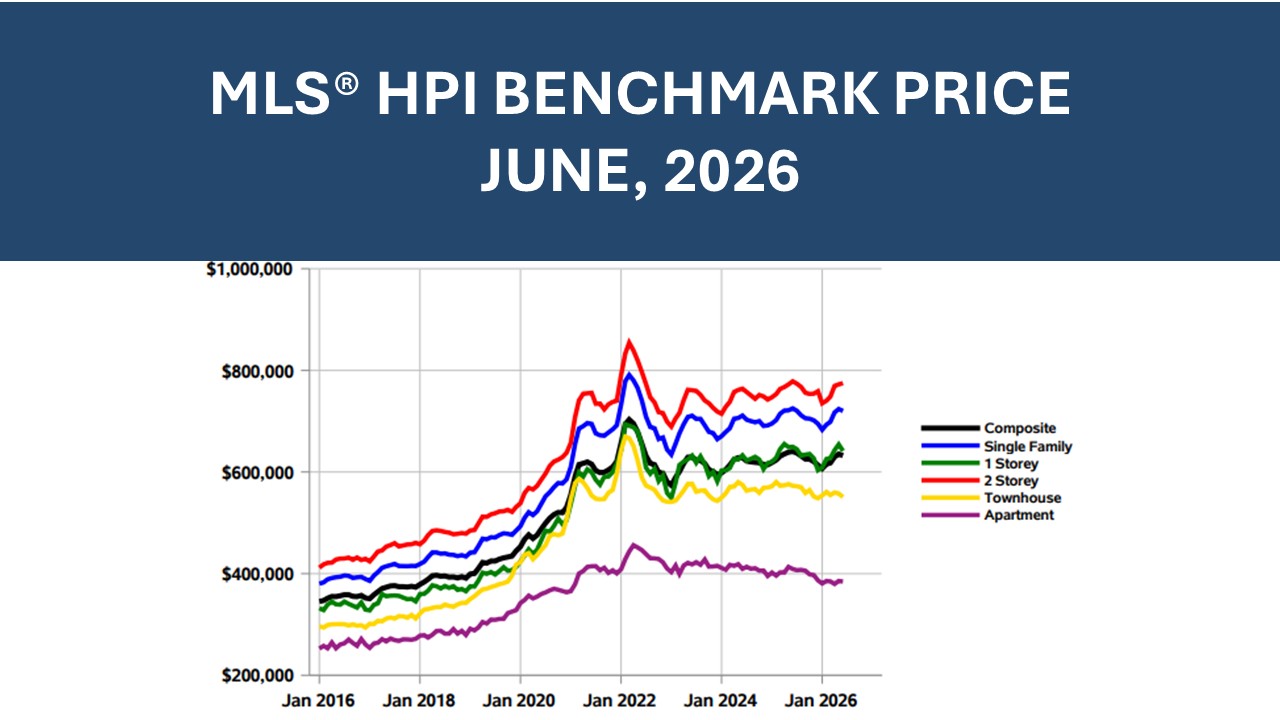
The MLS® Home Price Index (HPI) composite benchmark stood at $616,900, falling 1.3% year over year and 1.1% month over month.
Unlike average and median prices, which can be influenced by the types of properties selling in a given month, the HPI measures price changes using homes with consistent characteristics. Its seasonally adjusted figures showed a decline of approximately 0.5% in October, compared with a 1.5% decrease in September. This suggests that the rate of price adjustment may be slowing.
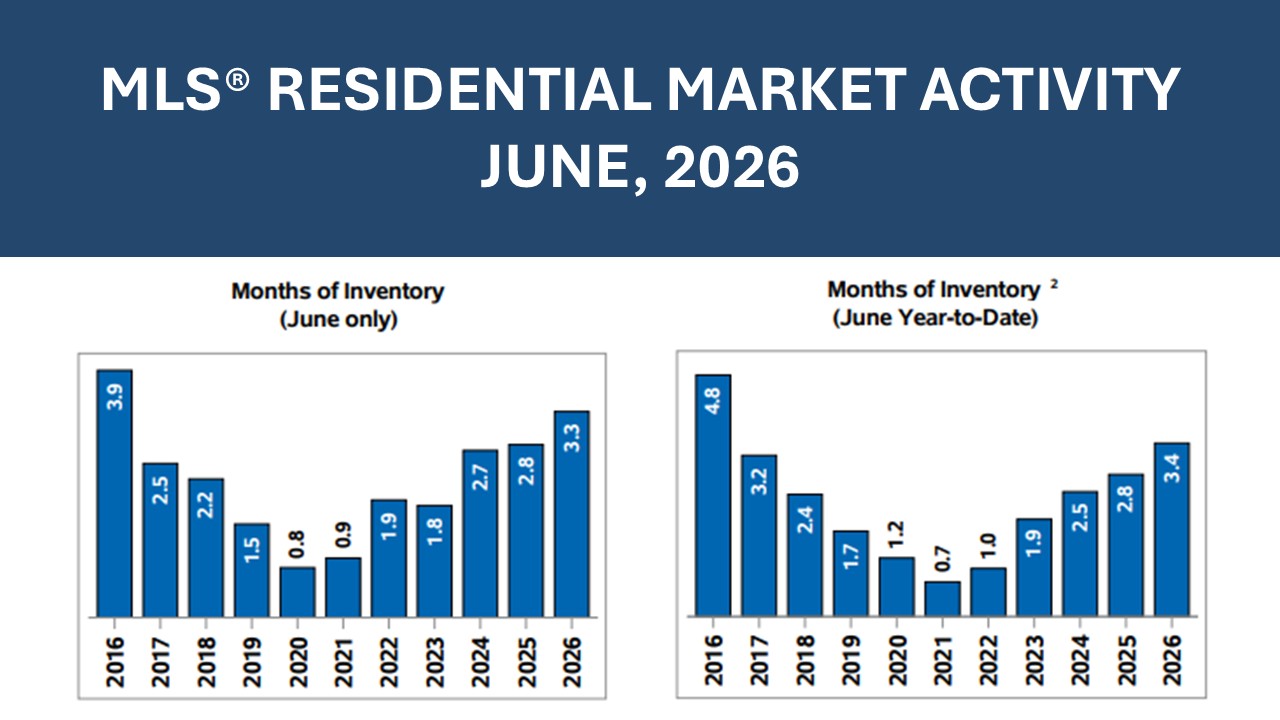
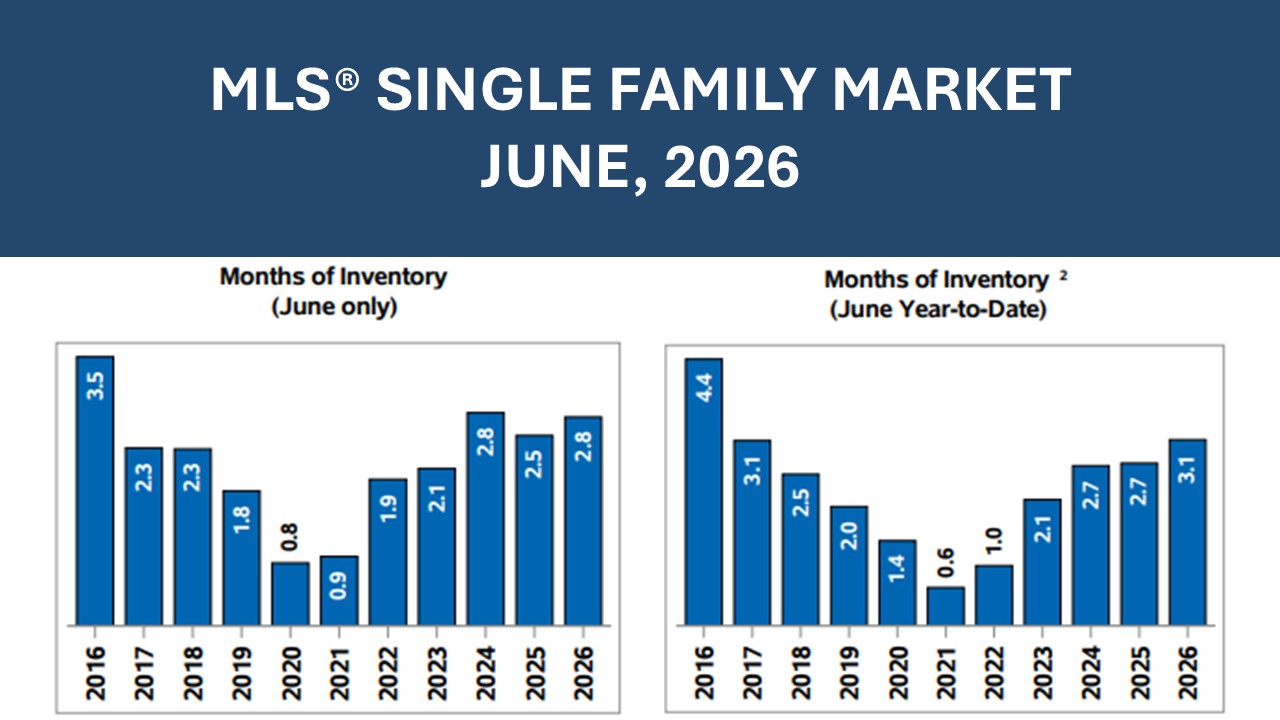
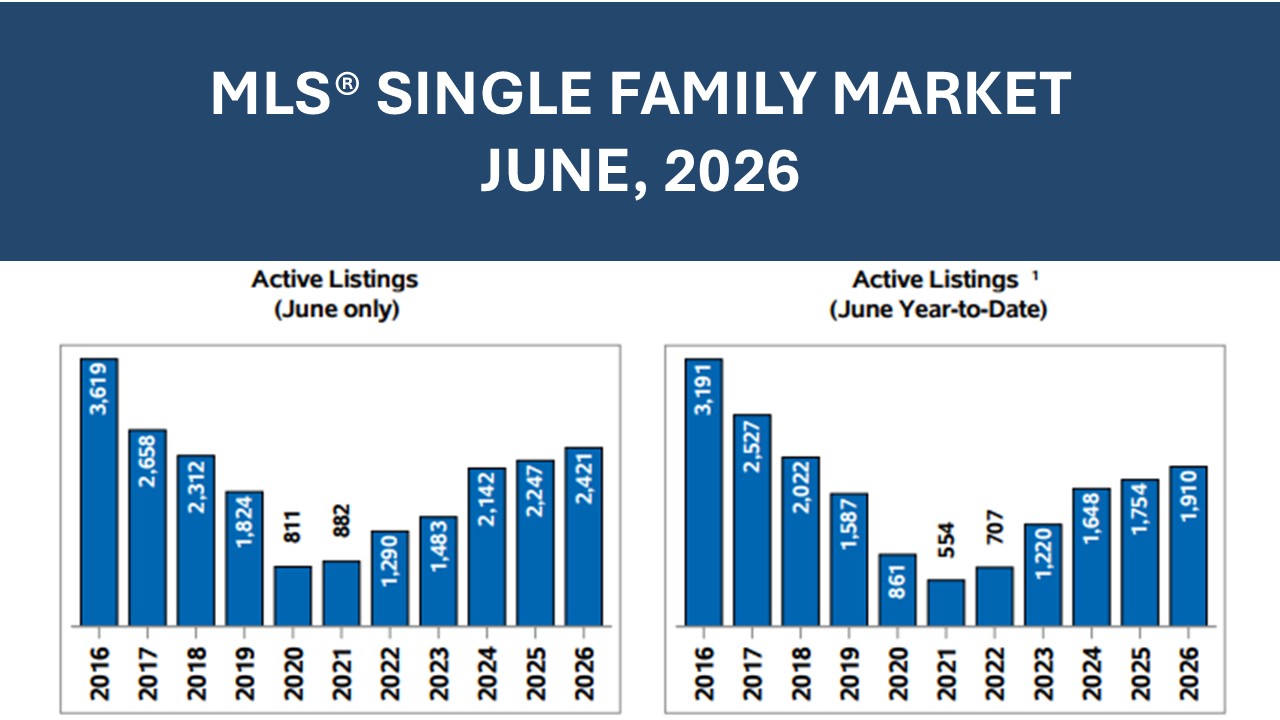
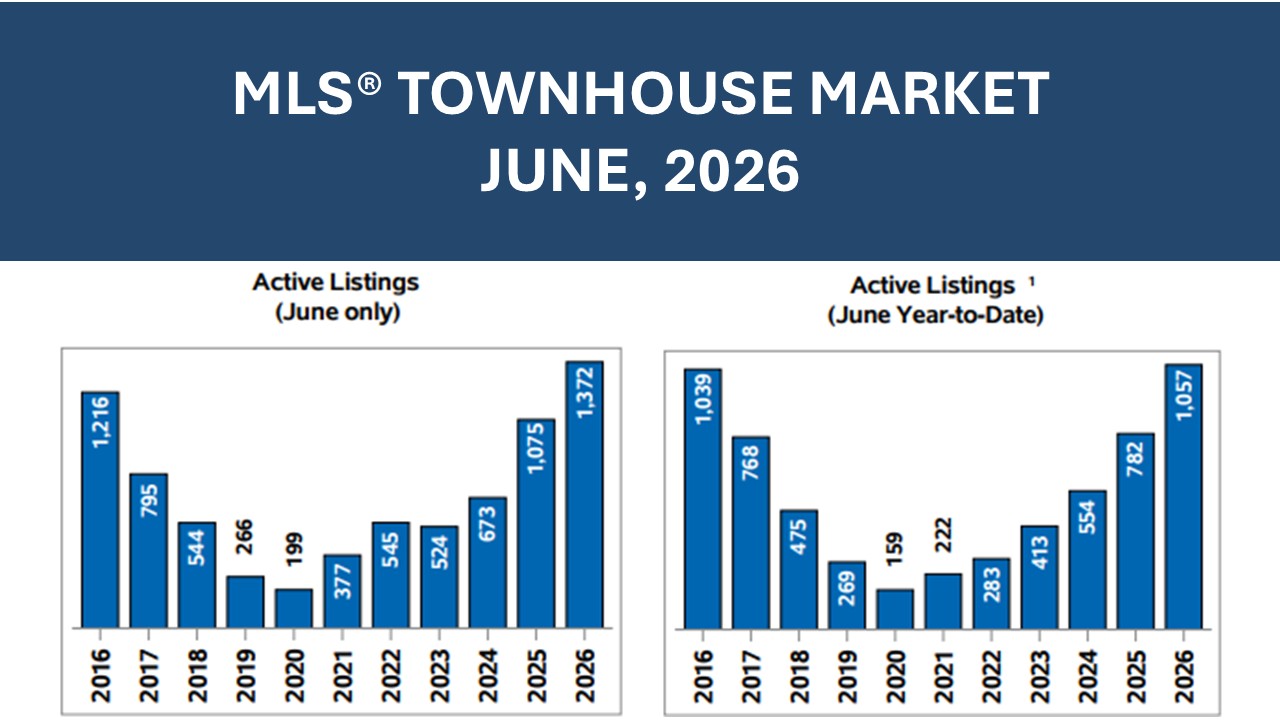
There were 4,582 active residential listings available at the end of October. Although this represented a 4.8% reduction from September, inventory remained 6.4% higher than it was a year earlier.
October’s active listing total was the second-highest for the month since 2016. The only higher figure during that period was recorded in October 2016, when inventory reached 5,075 properties.
Two important measures of market balance also shifted in October:
The sales-to-new-listings ratio increased from 34.5% in September to 44.0%.
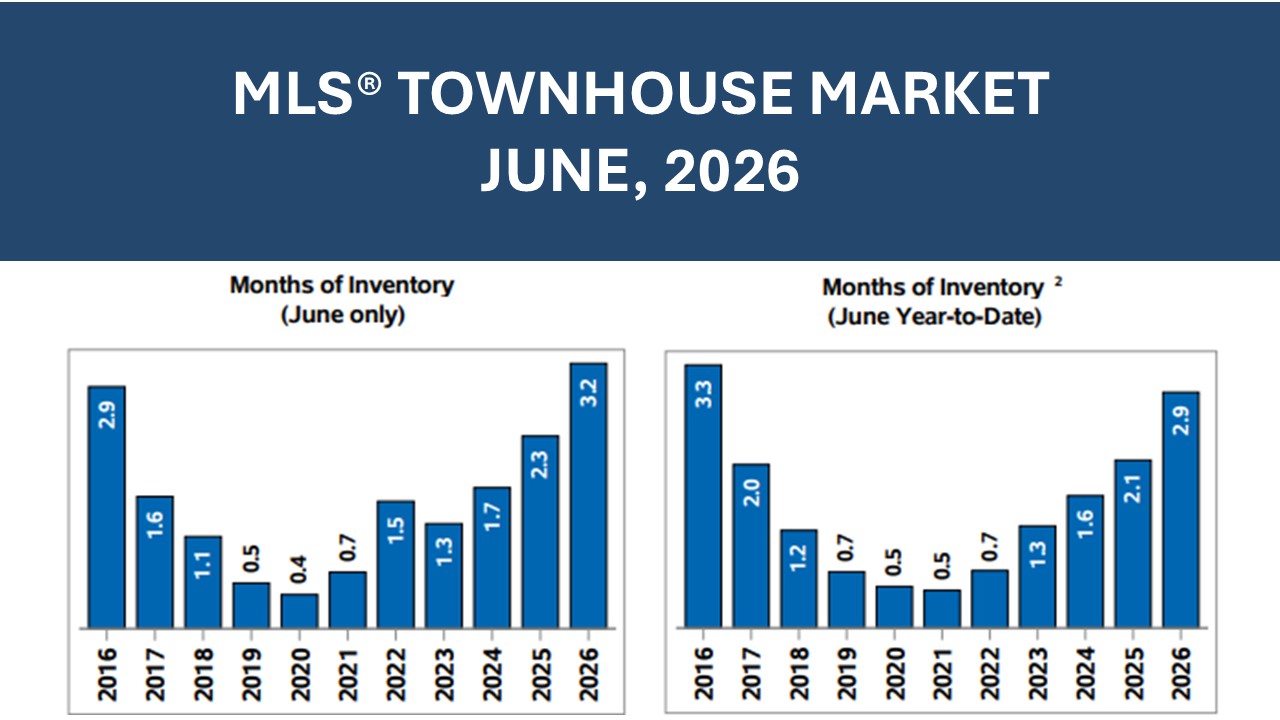
Months of inventory decreased from 4.8 to 4.4.
These changes indicate a somewhat tighter market compared with September, although the improvement was largely supported by the reduction in new properties coming onto the market, alongside the modest increase in completed sales.
New listings fell by 18.6% between September and October. For context, the median decrease across the previous 10 September-to-October periods was 14.6%, with every one of those years also recording a decline. This suggests that while the seasonal slowdown was expected, the reduction in new supply was more pronounced than usual.
Nevertheless, conditions remain less competitive for sellers than they were last year. In October 2025, the sales-to-new-listings ratio was 48.7%, while months of inventory stood at 3.7.
Properties sold for an average of 97.5% of their original listing price, unchanged from September but below the 97.9% recorded in October 2025. The median time required to sell a property was 25.5 days, improving from 27 days in September and sitting close to the 25 days recorded a year earlier.
Market conditions also varied considerably depending on property type:
Single-family homes: Inventory represented 4.0 months of supply, with a benchmark price of $699,200. This was 0.8% lower than a year earlier.
Townhouses: Months of inventory stood at 3.6, while the benchmark price reached $539,800, down 4.3% annually.
Apartments: Supply remained considerably higher at 7.4 months of inventory, compared with 7.3 in September and 5.8 in October 2025. The apartment benchmark price was $377,500, representing a 5.3% annual decrease and a 0.9% decline from September.
Apartments continue to face the most challenging conditions of Ottawa’s three main property categories. Their higher inventory levels and continued price adjustments have made this segment particularly sensitive to the softer market environment throughout 2026.
How Different Areas of Ottawa Performed
Although Ottawa’s overall market showed some improvement during October, activity and inventory levels differed across the city’s suburban, central and rural communities.
The suburban market remained the largest contributor to residential transactions, accounting for 753 sales, or 71.9% of all properties sold across Ottawa. Despite this significant share of activity, each of the three suburban areas recorded fewer sales than in October 2025.
Given how much of the city’s overall activity takes place in these communities, the annual slowdown across the suburbs played an important role in keeping Ottawa’s overall sales figures below last year’s levels.
In general, suburban locations continued to demonstrate stronger market conditions than central and rural areas.
Ottawa Suburb East recorded the tightest conditions across all seven submarkets, with 3.5 months of inventory and a sales-to-new-listings ratio of 51.0%.
Other suburban areas also maintained relatively balanced supply levels:
Ottawa Suburb West recorded 3.7 months of inventory.
Ottawa Suburb South recorded 4.1 months of inventory.
By comparison, Ottawa Centre and Ottawa Rural East experienced higher inventory levels, at 6.6 and 7.3 months respectively. Rural East was also one of the areas where inventory increased compared with September, highlighting that the improvement seen in the wider Ottawa market was not reflected uniformly across every community.
The remaining rural markets recorded more moderate supply levels. Ottawa Rural South had 4.1 months of inventory, while Ottawa Rural West recorded 4.4 months.
However, transaction volumes in these locations were considerably smaller, with just 57 sales in Rural South and 66 in Rural West. As a result, individual monthly changes can have a greater influence on the figures, making longer-term comparisons particularly important.
For anyone considering buying or selling, these local differences reinforce the importance of looking beyond citywide statistics. Pricing, buyer competition and the time a property may spend on the market can vary significantly depending on its neighbourhood and property category.
October’s figures suggest some easing in overall market conditions, but understanding the supply and demand within a specific area remains essential when deciding how to approach a sale or purchase.
What Could Shape Ottawa’s Housing Market Over the Coming Months?
As Ottawa approaches the winter season, employment prospects, borrowing costs and government housing policy are likely to remain significant influences on real estate activity.
Employment uncertainty is a particular concern for the region. An analysis from the Canadian Centre for Policy Alternatives, reported by the Ottawa Citizen, identified approximately 15,000 fewer people employed locally since March 2025. This represented a greater employment decline than in any other large municipality in Ontario over the same period, with federal public-service reductions identified as a major contributing factor.
However, employment figures can tell different stories depending on the timeframe being considered. September’s seasonally adjusted employment estimate for the Ontario portion of the Ottawa–Gatineau census metropolitan area remained above the level recorded a year earlier, despite a decrease from August.
Previous periods of federal workforce reductions have coincided with weaker housing sales and rising inventory levels in Ottawa. While this historical relationship does not establish that employment cuts are responsible for all of the current market slowdown, it does highlight why further changes to the federal workforce are being closely monitored.
Federal Budget and Potential Housing Policy Changes
The federal budget, scheduled for release on November 5, could provide further clarity for Ottawa households and the wider housing sector.
Details surrounding potential public-service staffing changes will be particularly relevant for residents assessing their financial and employment outlook. Any new housing-related announcements could also influence affordability and purchasing decisions.
The Canadian Real Estate Association (CREA) has already outlined several recommendations in its pre-budget submission, including proposed changes to housing finance and mortgage insurance. One of its suggestions involves improving support for buyers purchasing individual units within small multiplex developments.
Whether any of these recommendations are adopted remains to be seen, but the government’s approach to housing affordability and financing will be another important factor to watch.
Interest Rates and the Wider Economic Picture
Economic conditions across Canada are also contributing to uncertainty among prospective buyers.
Statistics Canada reported that real gross domestic product (GDP) was essentially unchanged in August, followed by an advance estimate indicating a 0.1% contraction in September.
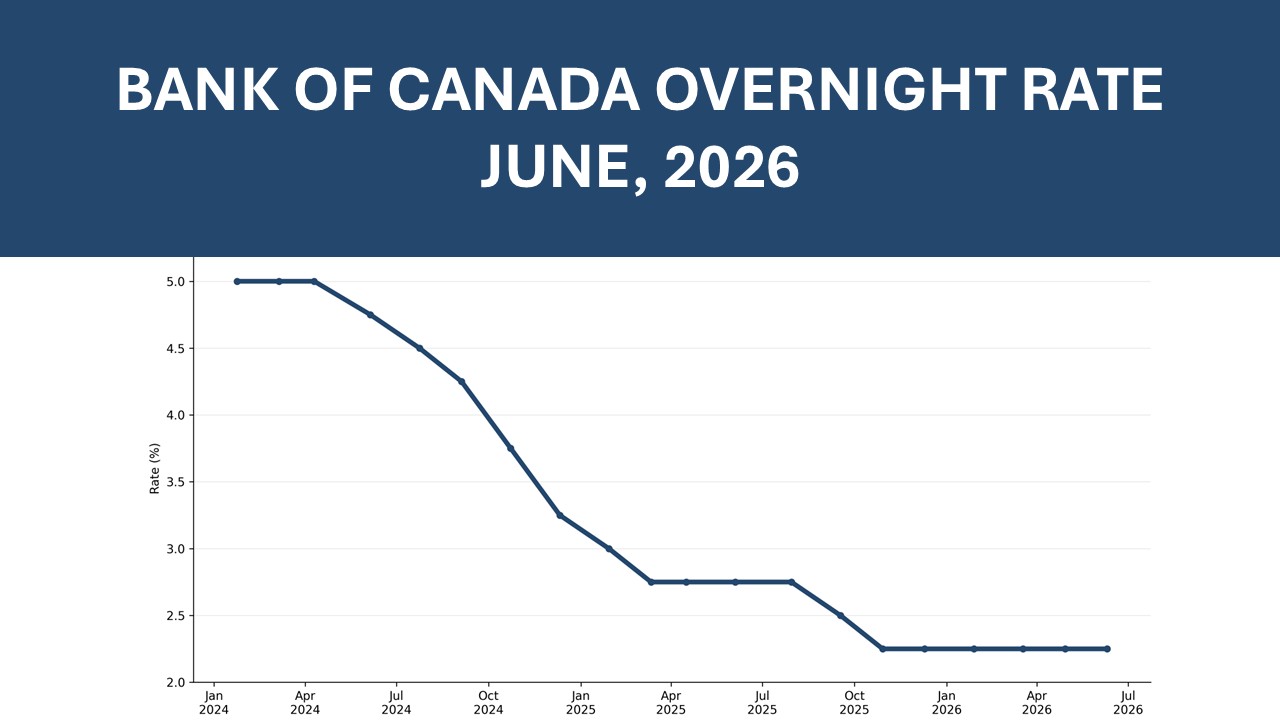
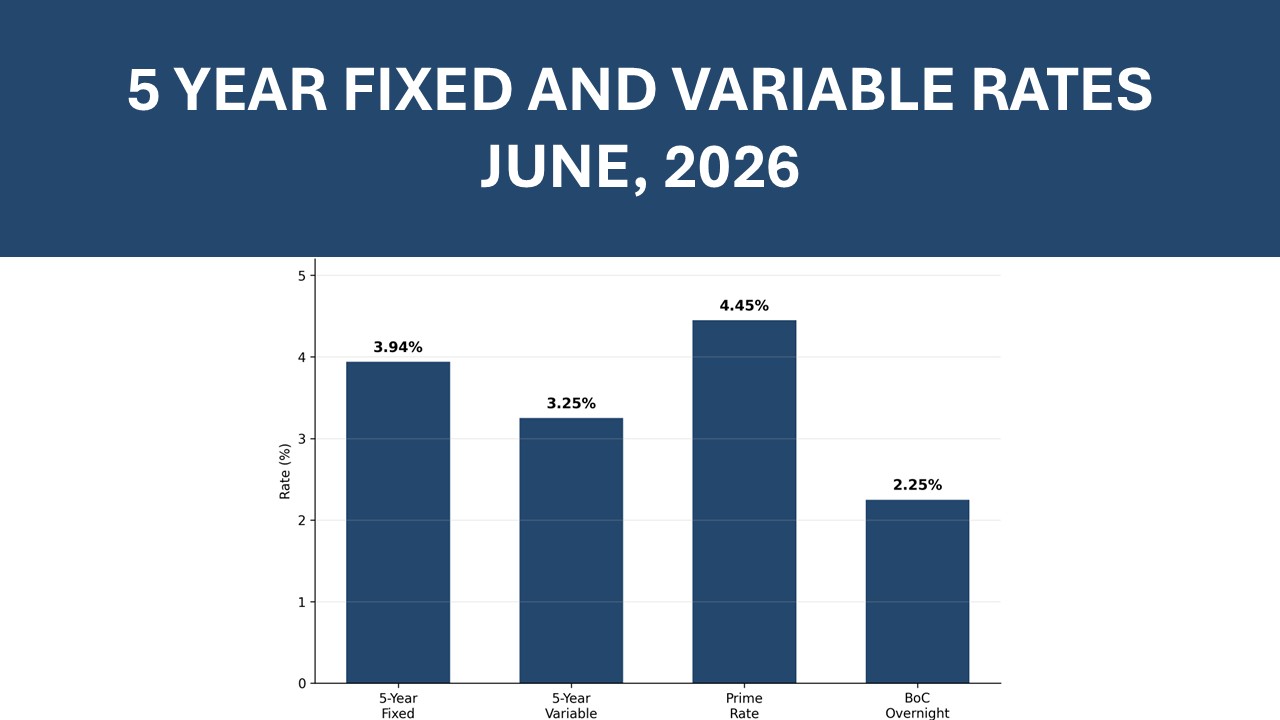
Borrowing costs have also moved in a different direction following the Bank of Canada’s October announcement. On October 28, the central bank increased its policy interest rate to 2.5%, marking the first rate increase in three years. Persistent inflation pressures were cited as a key reason behind the decision.
With affordability already a consideration for many households, changes in interest rates and the broader economic outlook could influence how confidently buyers approach the market over the coming months.
New Construction Adds Another Dimension to Housing Demand
Activity in Ottawa’s new-home market has also been worth watching, particularly as affordability measures may be influencing purchasing decisions.
According to the Greater Ottawa Home Builders’ Association (GOHBA), 521 new homes were sold in September, representing an 81.5% increase compared with September 2025. Cumulative sales between January and September were also up 53.8% year over year.
Expanded, temporary HST relief for eligible newly constructed homes may be contributing to their increased appeal compared with existing resale properties.
Although the available figures do not demonstrate that buyers are moving away from resale homes in favour of new construction, the difference in activity between the two segments makes new-home sales an important part of the wider Ottawa housing picture.
As the year draws to a close, the relationship between resale inventory, new construction, affordability and buyer confidence will be worth monitoring.
Final Thoughts
October’s Ottawa housing statistics point towards a market that may be gradually finding a more balanced position, although buyers continue to benefit from greater choice and less competitive conditions than they experienced a year ago.
The increase in monthly sales and reduction in new listings provided some relief for sellers, while lower months of inventory suggested a modest improvement in market conditions. However, annual sales and price comparisons remain weaker, with apartments continuing to experience the greatest pressure.
Looking ahead, the direction of Ottawa’s real estate market will depend on more than seasonal changes alone. Employment stability, federal housing decisions, interest rates and affordability will all play a role in determining how buyers and sellers approach the months ahead.
For now, October offers some encouraging signs, but a sustained recovery
Ottawa’s real estate market continued to slow in September, with 1,010 homes sold, down 6.6% compared to September 2025. While sales increased slightly from August, overall activity remained below typical seasonal levels.
Between July and September, 3,336 homes sold, down 8.2% from the same period last year, making it one of Ottawa’s slowest summer markets in the past decade.
Sales declined across all major property types, with condominium apartments experiencing the largest drop at nearly 25% year over year.
Home Prices and Market Conditions
The average sale price was $685,640, down 1.0% from September 2025, while the median price was $625,000. The MLS® benchmark price was $623,500, down 2.2% from August, suggesting some underlying downward pressure on home values.
Inventory continues to rise, giving buyers more options and creating increased competition among sellers.
New Listings: 2,927, up 3.0% year over year
Active Listings: 4,813, up 7.9% year over year
Months of Inventory: 4.8
Average Sale-to-List Price Ratio: 97.5%
Median Days on Market: 27 days, up from 22 last year
How Are Different Property Types Performing?
Detached Homes: Benchmark price of $705,100, relatively unchanged year over year.
Townhomes: Benchmark price of $546,500, down 2.2% from last year.
Condominium Apartments: Benchmark price of $380,800, down 6.1% year over year. With 7.3 months of inventory, condos remain the softest segment of the market.
Regional Market Comparison
Ottawa’s suburban markets continued to lead the way in September, accounting for nearly 73% of all home sales. However, sales across the west, east, and south suburbs were down 8% compared to last year.
Ottawa’s west end remained the strongest-performing area, with just 3.7 months of inventory, compared to 4.3 months in the east and 4.4 months in the south.
Meanwhile, Ottawa Centre and rural areas experienced softer conditions, with higher inventory levels and slower sales activity, giving buyers more negotiating power.
Looking Ahead
As we move further into the fall market, the biggest trend to watch is the growing number of homes available compared to the number of buyers making purchases.
September saw a 38% increase in new listings from August, while sales remained relatively unchanged. This has created more competition for sellers and additional opportunities for buyers.
The condominium market continues to face the greatest challenges, while new construction sales have been gaining momentum, potentially drawing some buyers away from resale properties.
Looking ahead, most forecasts suggest modest price growth and a gradual market recovery rather than a significant rebound in the near future.
Our outlook: We expect buyers to remain cautious and pricing to play a major role in how quickly homes sell. As inventory typically declines later in the fall, October and November will give us a better indication of whether the market is beginning to stabilize or if softer conditions will carry into 2027.
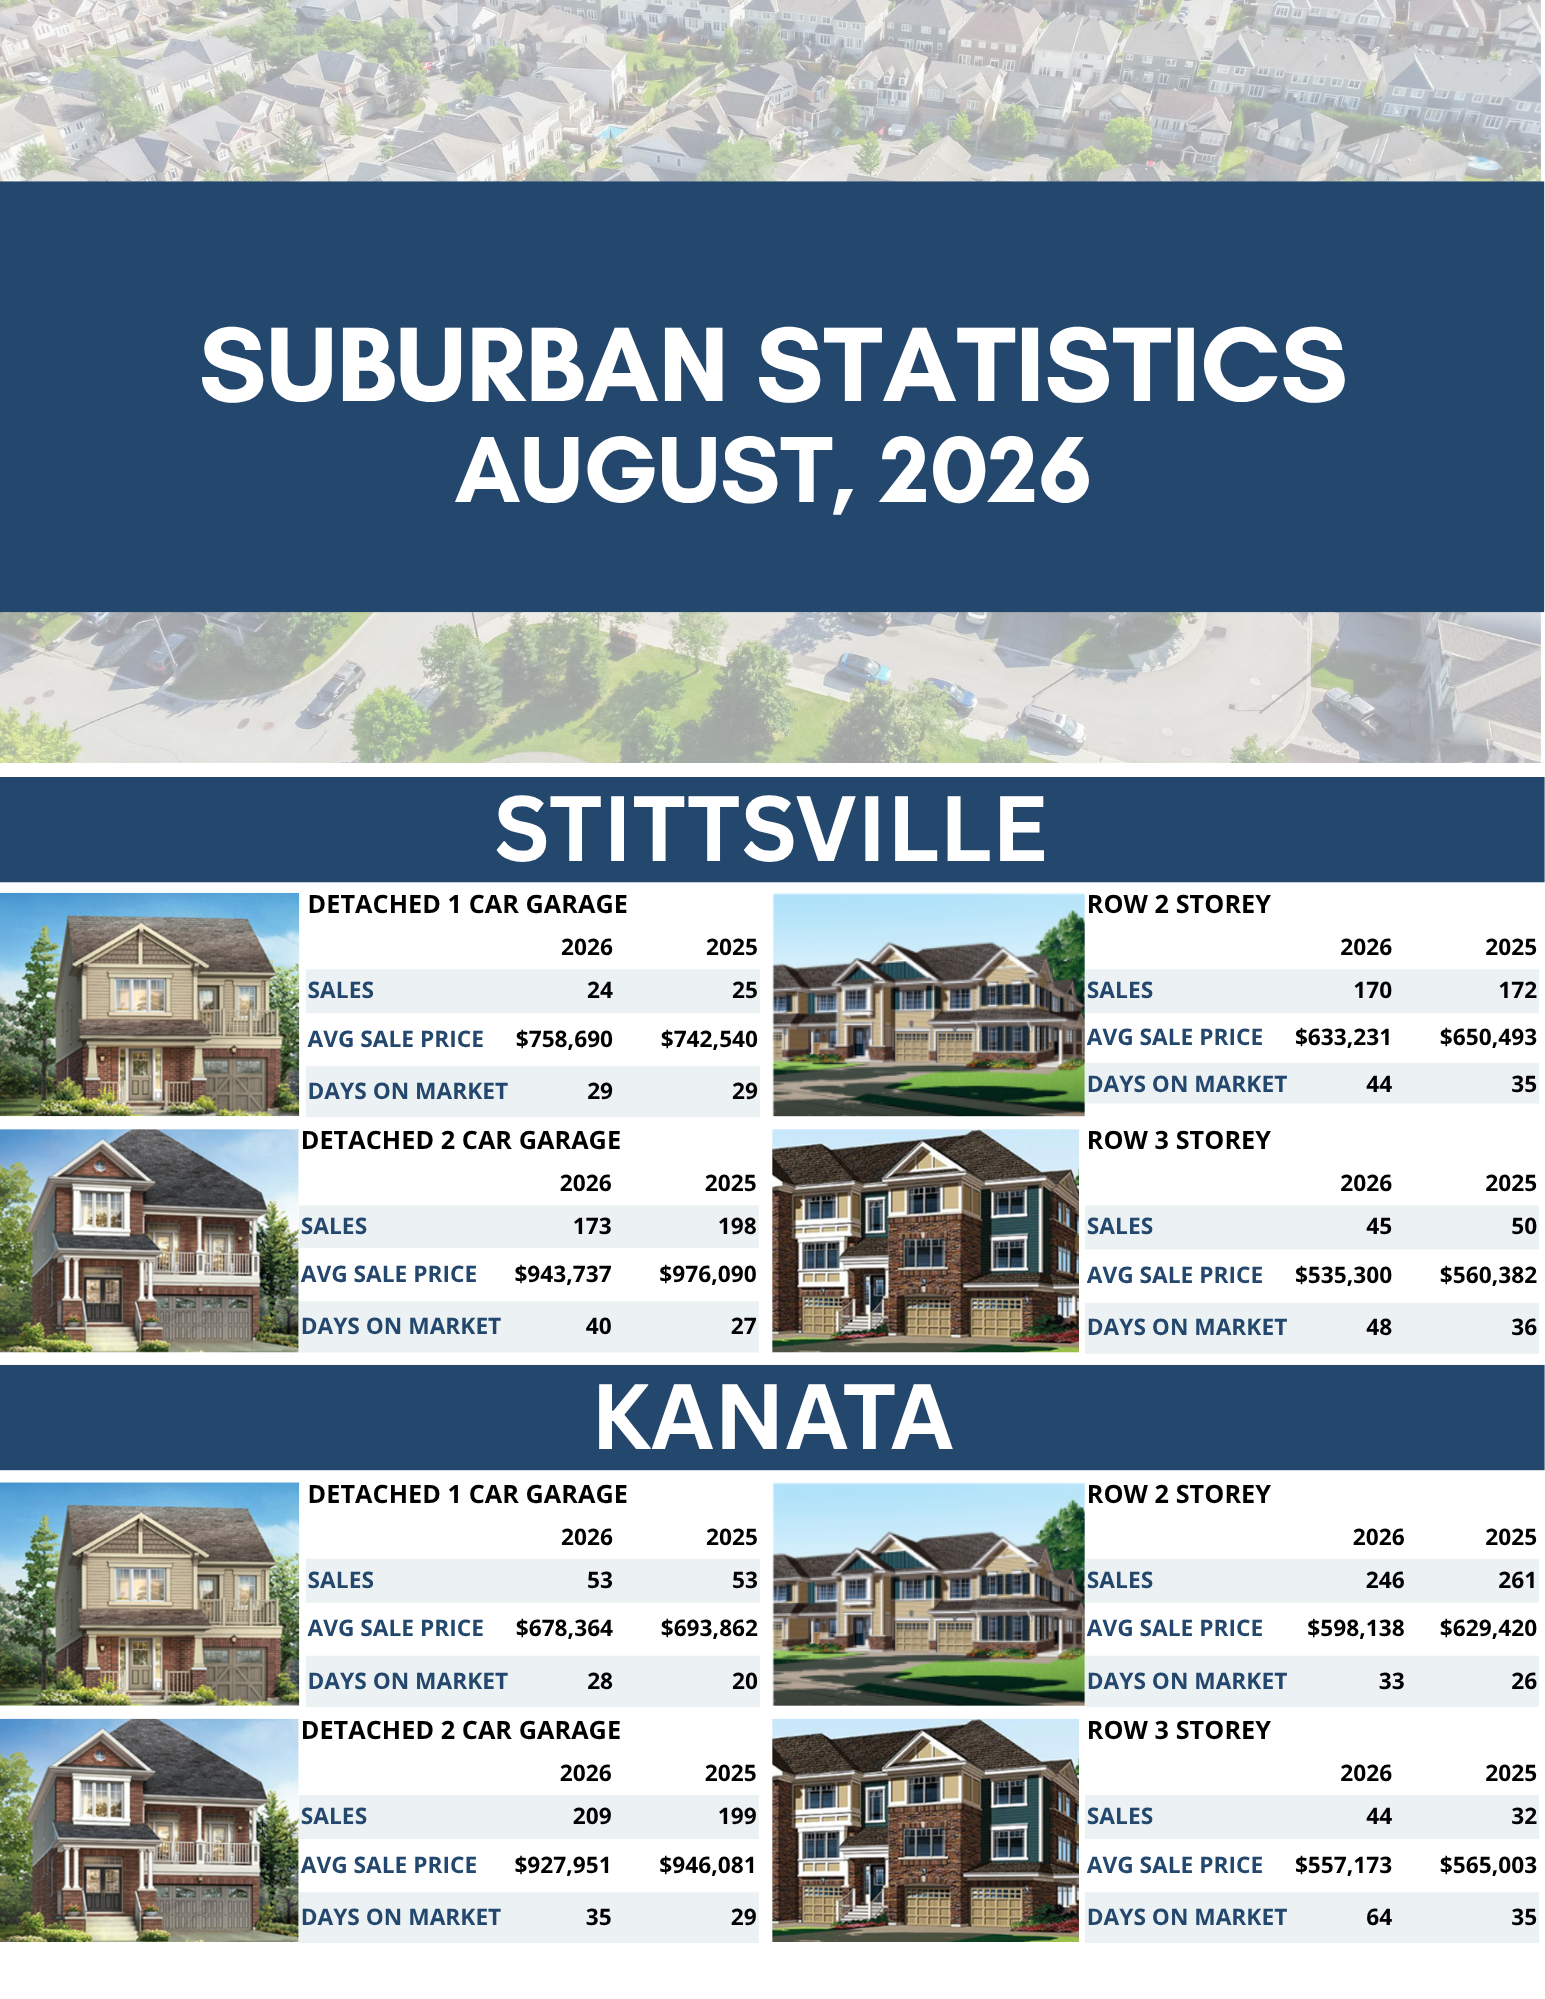
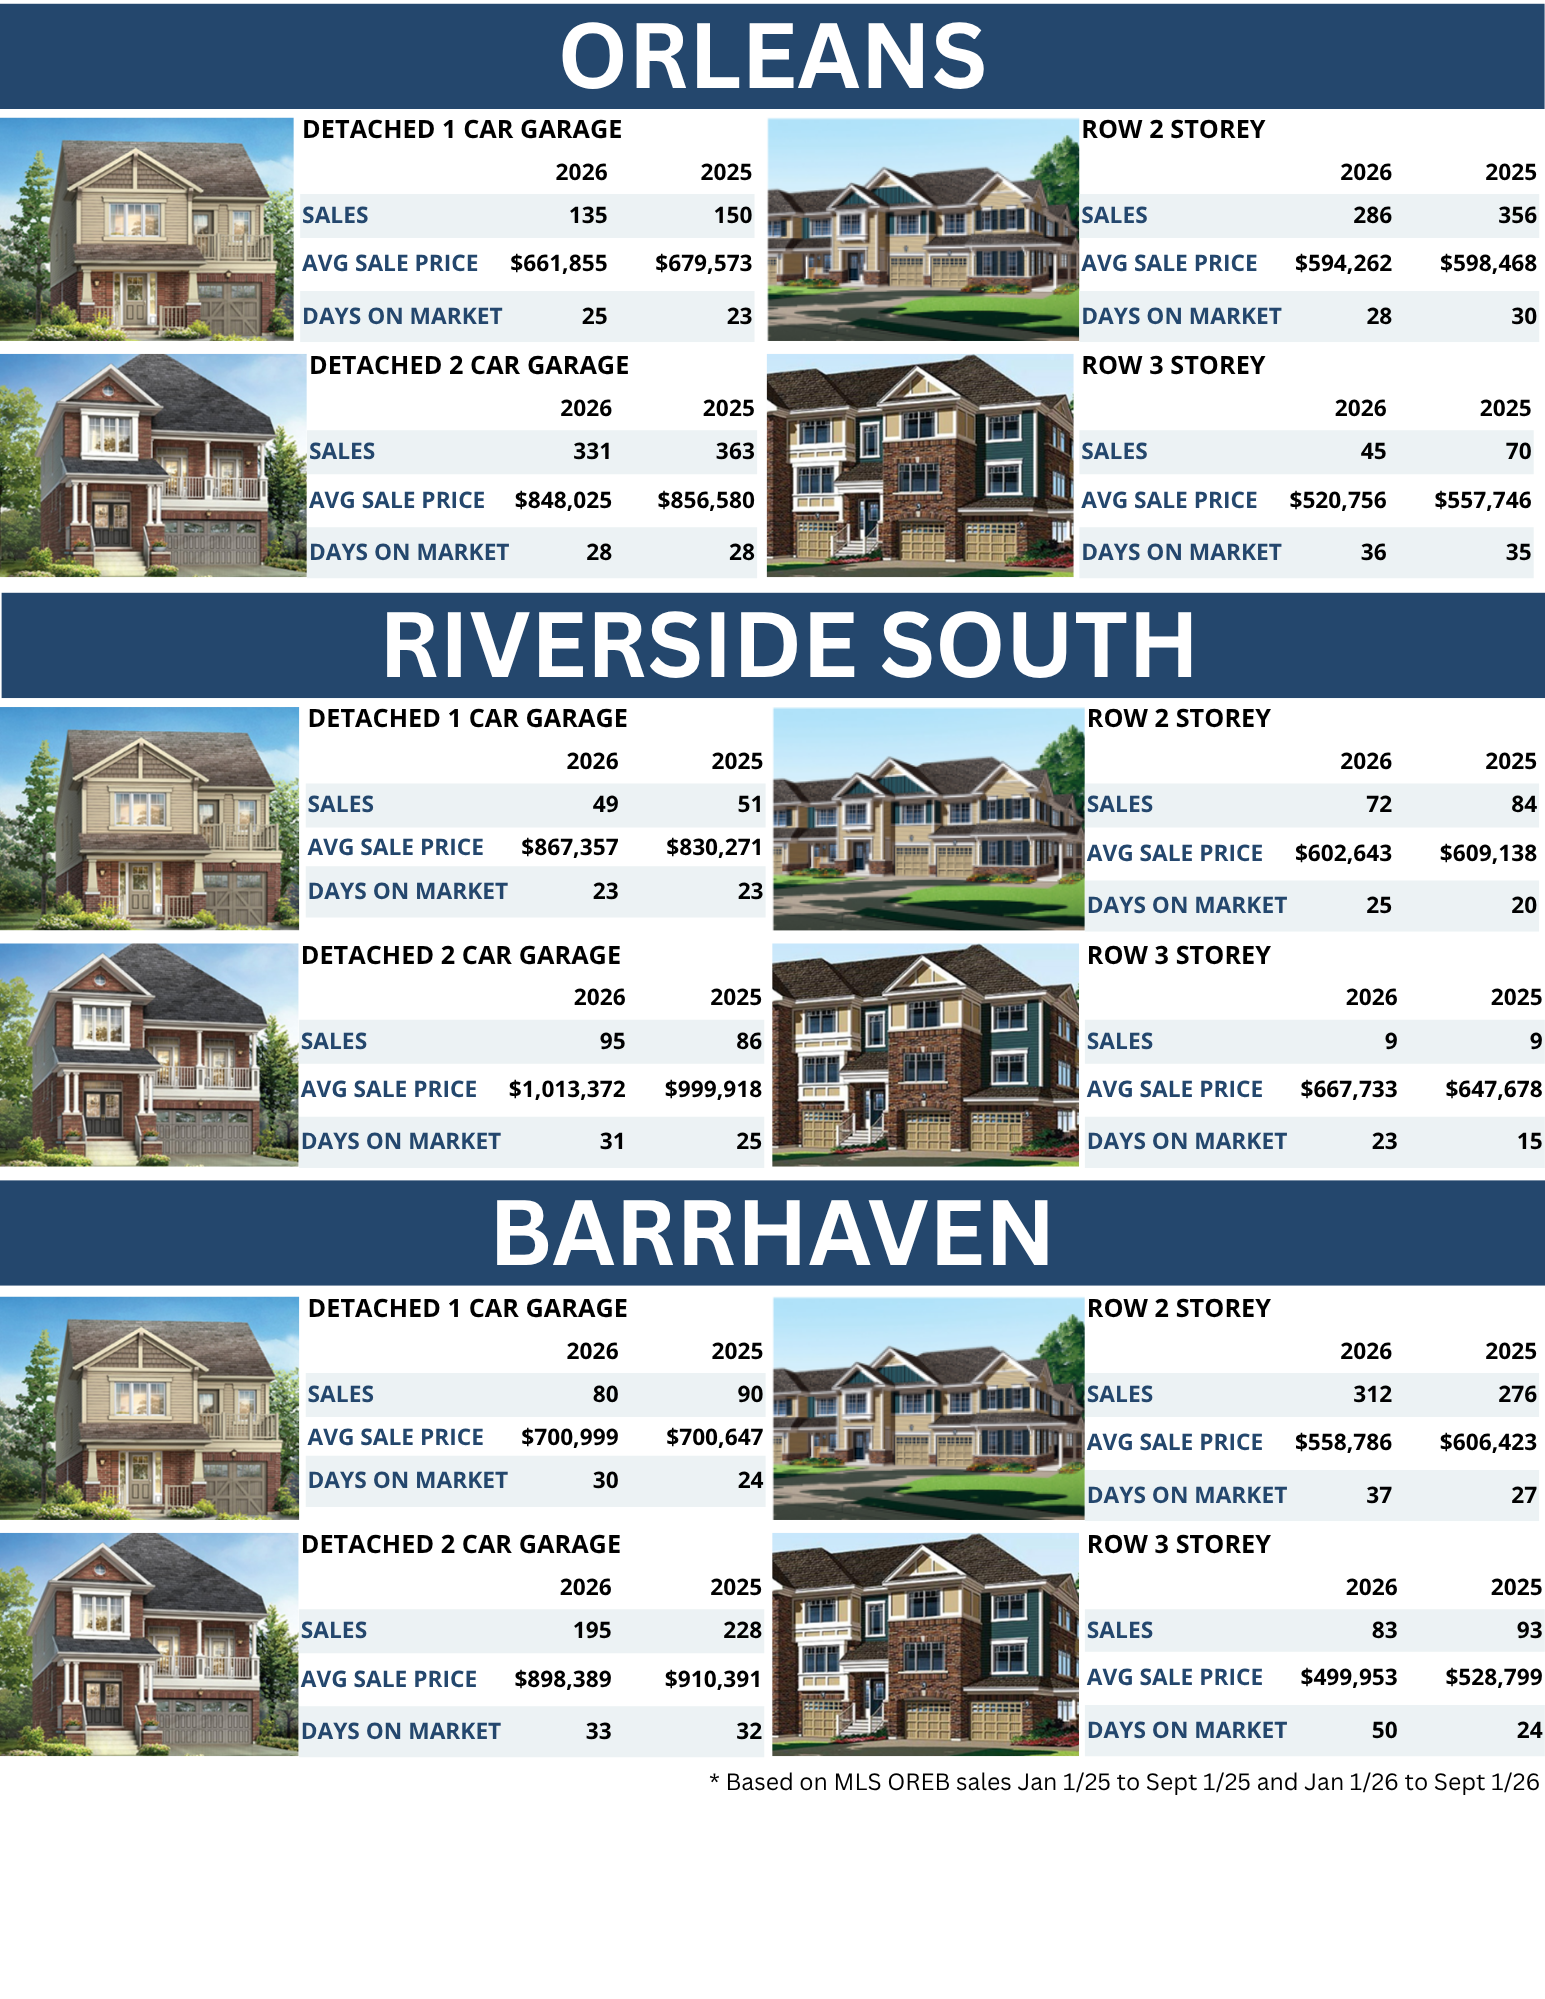
Ottawa’s real estate market continues to tell a different story from one neighbourhood to the next. While city-wide statistics provide a useful snapshot, sales activity, pricing trends, and buyer demand can vary significantly across individual communities.
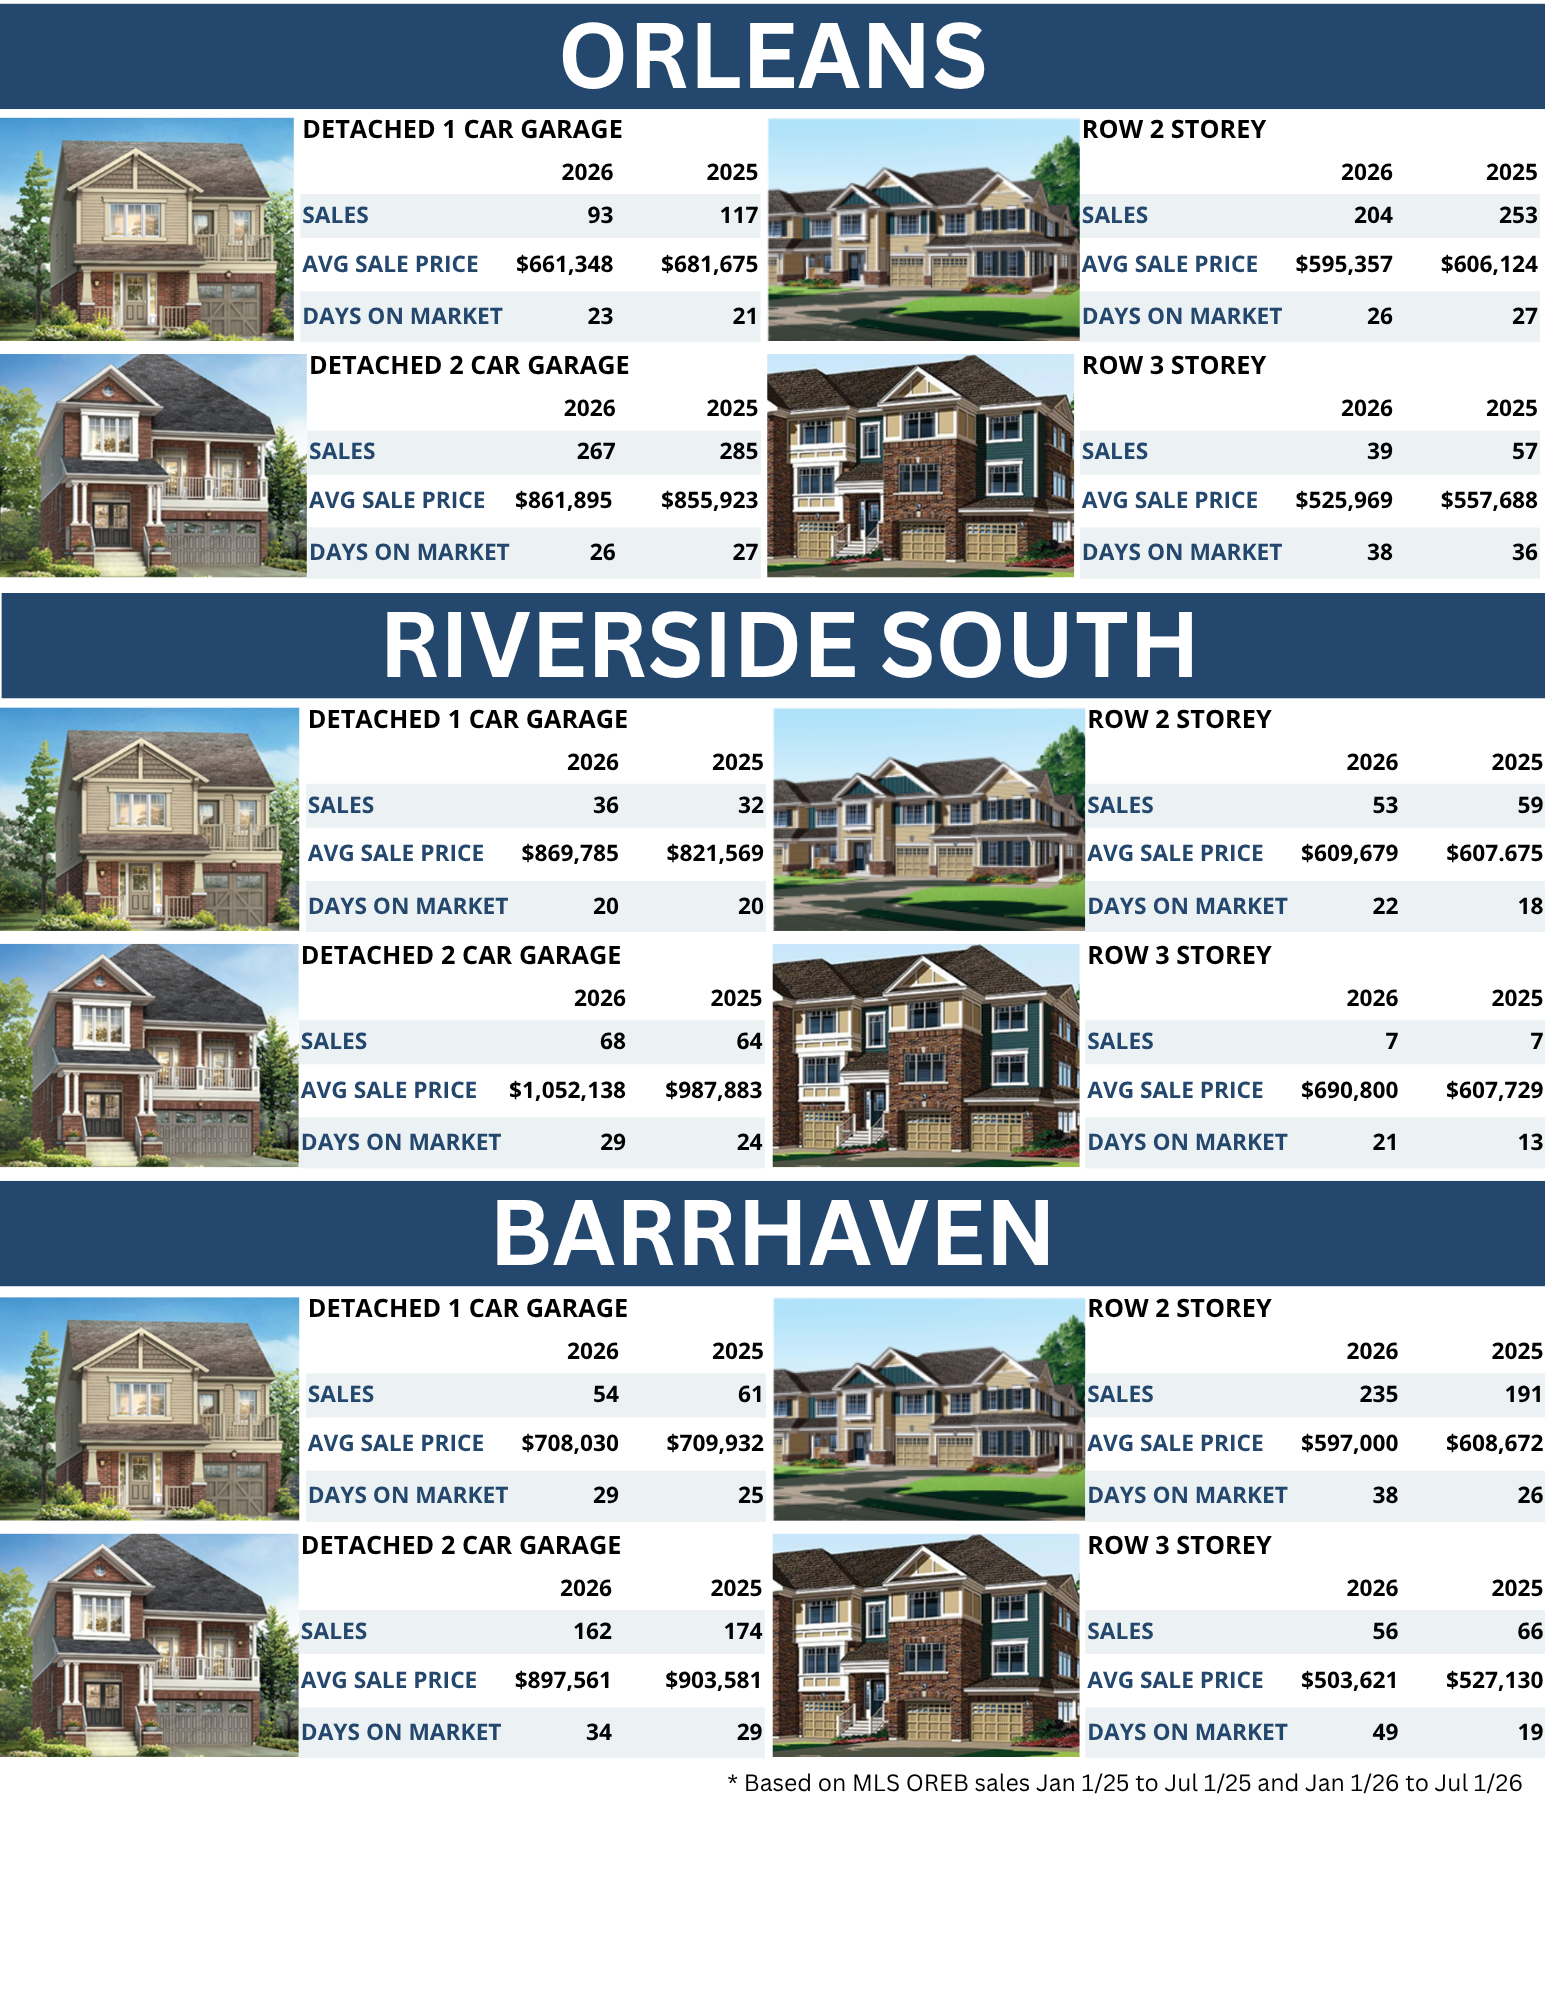
In this August edition of our Suburban Statistics Series, we’re taking a closer look at five of Ottawa’s major suburban markets to see how each has performed so far in 2026. Using MLS® sales reported through OREB, we’ve compared activity from January 1 to August 31, 2026, with the same period in 2025 to highlight the trends taking shape across Ottawa’s suburban communities.
The Ottawa real estate market slowed noticeably in August, with sales falling more sharply than we would typically expect at this point in the summer. At the same time, home prices have remained relatively stable, creating a market where buyers have more choice and negotiating power, while sellers need to be increasingly thoughtful about pricing and positioning. This does not apply to a few hot spots in the Ottawa market like Old Ottawa South and part of the Glebe.
Ottawa Home Sales Slow in August
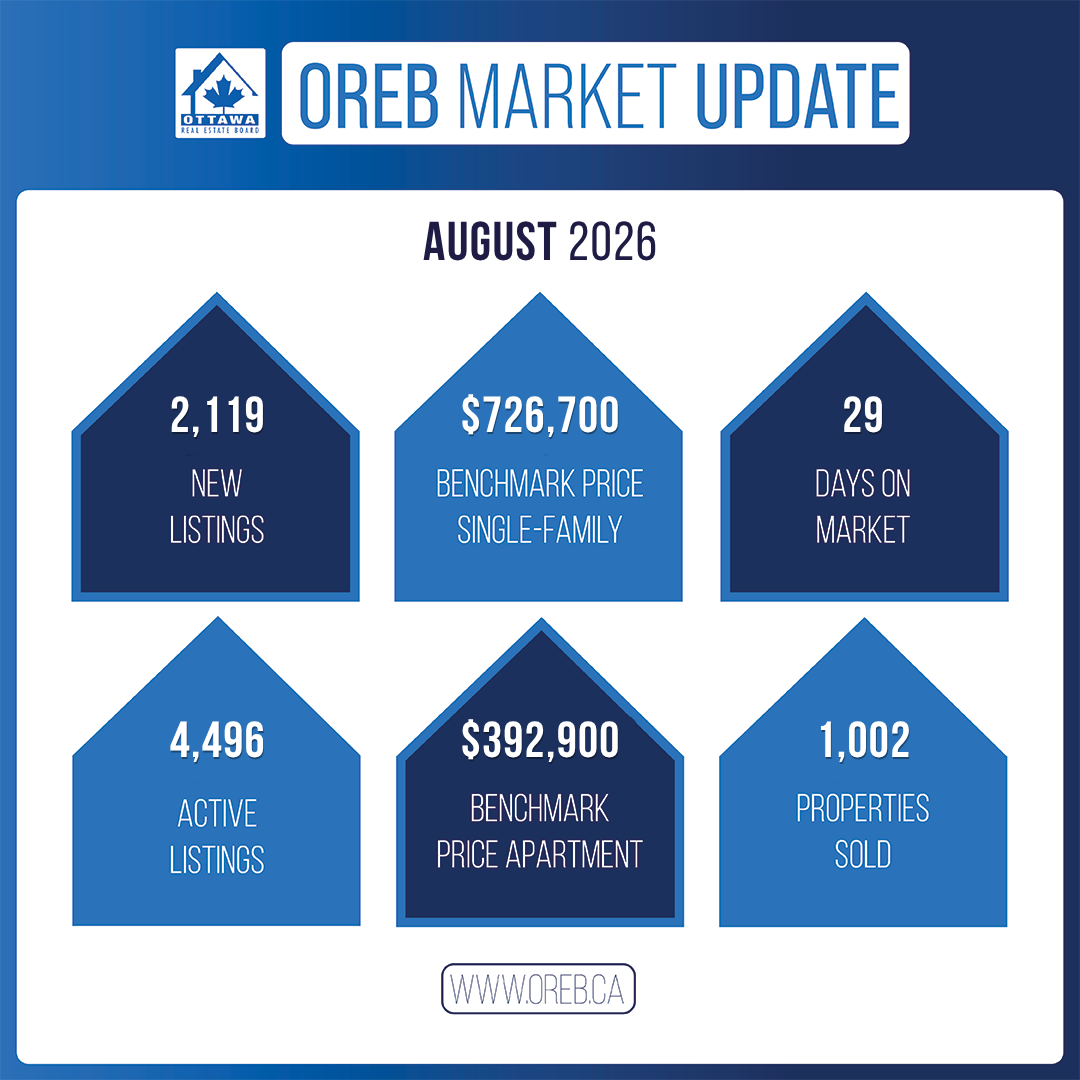
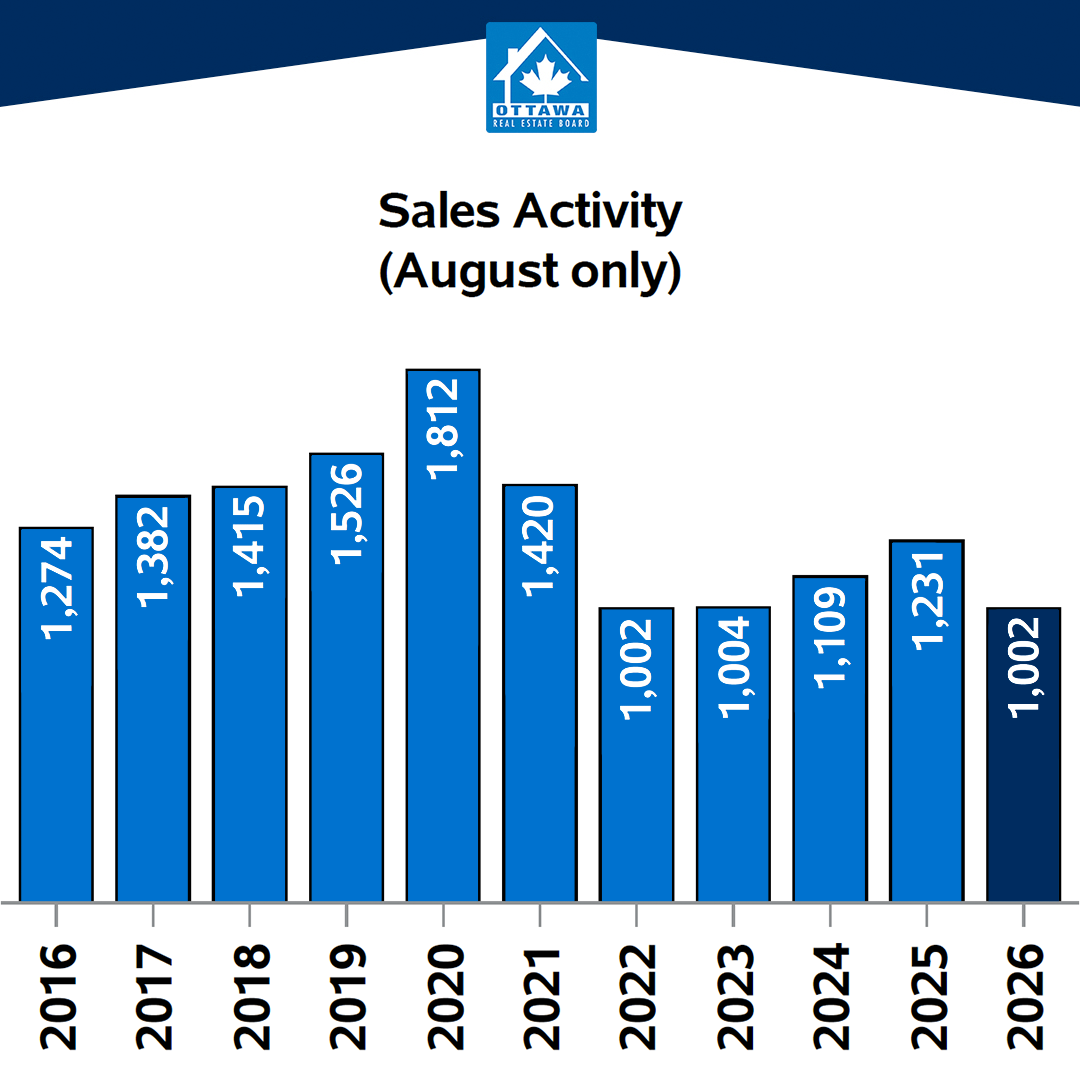
A total of 1,002 homes sold in Ottawa in August, representing an 18.6% decrease compared to August 2025 and a significant 24.4% decline from July.
Some month-to-month slowdown is normal during the summer, but this year’s decline was considerably larger. Over the previous 10 years, the typical decrease in sales from July to August was just 5.8%.
The slowdown was also seen across all major property types:
Single-family home sales declined 16.3% year over year
Townhouse sales declined 19.9%
Apartment sales declined 22.3%
Year to date, Ottawa has recorded 9,283 home sales, down 6.9% compared to the same period in 2025.
Ottawa Home Prices Remain Relatively Stable
Despite the significant slowdown in sales, prices have held up reasonably well.
The average residential sale price was $688,253, up 0.3% from August 2025. The MLS® Home Price Index composite benchmark price reached $637,700, up 1.0% year over year.
The median sale price was $622,357, down 1.2% compared to last August.
This is an important distinction in the current market. We are seeing fewer transactions and buyers taking more time to make decisions, but that has not translated into a significant decline in overall Ottawa home values.
Buyers Have More Choice
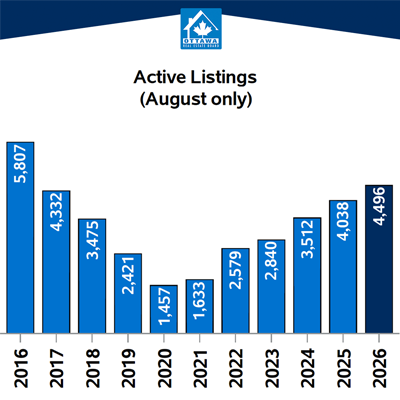
There were 4,496 active listings in Ottawa at the end of August, an increase of 11.3% from the same time last year.
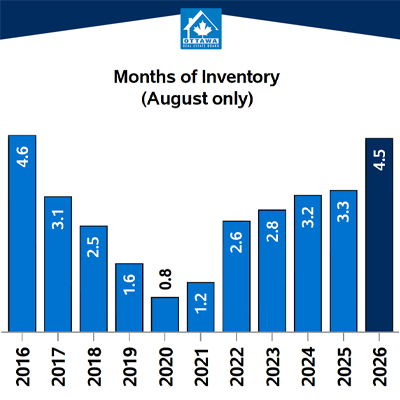
Months of inventory increased from 3.5 months in July to 4.5 months in August — the highest August level since 2016.
The sales-to-new-listings ratio also declined to 47.3%.
Together, these numbers point toward a more balanced and increasingly buyer-friendly environment. Buyers generally have more properties to choose from, more time to make decisions and, depending on the property, greater ability to negotiate.
For sellers, this means that simply putting a home on the market and waiting for buyers to compete is not a reliable strategy. Pricing, presentation and marketing all matter considerably in the current environment.
Single-Family Homes Remain Relatively Strong
There are also important differences depending on the type of property you’re selling.
Single-family homes have remained the most stable of Ottawa’s major housing segments. Their benchmark price was up 2.2% year over year, with approximately four months of inventory.
Townhouses are experiencing more pressure, with active listings up 27.1% from last year and the benchmark price down 4.0%.
Apartments remain the softest segment of the Ottawa market, with 6.3 months of inventory and a median of 42 days on market.
This is why looking only at the overall Ottawa average doesn’t tell the whole story. Conditions can vary considerably depending on the type of home, price range and neighbourhood.
How Are Different Parts of Ottawa Performing?
The slowdown wasn’t limited to one part of the city.
Ottawa’s suburban markets continued to account for more than 70% of residential sales in August, although sales declined year over year across the west, east and south suburban areas.
Ottawa Suburb West was the strongest of the three major suburban markets, recording 3.6 months of inventory and a sales-to-new-listings ratio of 51.9%.
Interestingly, Ottawa Rural West was the only submarket to record an increase in sales compared to last year, although the relatively small number of transactions means that result should be interpreted cautiously.
Conditions were softer in central Ottawa and Ottawa Rural East, where inventory levels were considerably higher.
What Does This Mean for Ottawa Sellers?
The market is slower, but homes are still selling.
The important difference is that buyers have become more selective. With more competition on the market, homes that are priced too aggressively can sit while buyers choose better-positioned alternatives.
For anyone currently selling, I think it’s important to regularly review three things: recent sales, new competing listings and buyer activity on your property.
If the market is providing feedback through limited showings or repeated objections to price, sellers need to be willing to respond.
At the same time, Ottawa prices have remained relatively resilient, so this isn’t necessarily a market where sellers need to panic. It’s a market that rewards realistic pricing and a strong strategy.
Looking Ahead to the Fall Ottawa Real Estate Market
The big question is whether August was simply a particularly slow summer month or the beginning of a more sustained slowdown.
There are some encouraging economic signs, but uncertainty remains. The market report notes that CMHC expects Ottawa sales to stabilize, while increasing supply and slower demand growth could limit price appreciation.
As we move into September and the fall market, we’ll be watching sales activity, inventory and new listings closely.
For buyers, the current environment may provide opportunities that weren’t available in more competitive markets.
For sellers, understanding the specific conditions surrounding your neighbourhood and property type will be increasingly important.
Thinking about buying or selling a home in Ottawa? Every neighbourhood and price range is behaving differently right now. Reach out to the Chris Scott Team for an up-to-date look at what’s happening in your specific area and how the current market could impact your plans.
One of the most common questions we get from homeowners preparing to sell is whether they should renovate before putting their home on the market. The answer is usually: it depends… and don’t start spending money just yet.
There are certainly improvements that can help your home sell faster or for more money. But there are also renovations that cost far more than you’ll ever get back when you sell.
Start With the Easy Stuff
Before considering a major renovation, take care of the smaller things buyers will notice. Fresh paint, updated light fixtures, repairing damaged trim, replacing worn carpet and taking care of obvious maintenance items can make a surprisingly big difference.
These aren’t exciting renovations, but they can make a home feel cleaner, newer and better maintained without a huge investment. You will almost always recoup the investment on these items. The bonus will also be that you will sell quicker.
Be Careful With Kitchens and Bathrooms
Kitchens and bathrooms are important to buyers, but that doesn’t automatically mean you should renovate them before selling.
Spending $50,000 on a new kitchen doesn’t necessarily increase the value of your home by $50,000. Sometimes an older but well-maintained kitchen is perfectly acceptable, particularly if the home is priced accordingly.
There are also plenty of buyers who would rather renovate themselves and choose their own finishes.
Think About Your Competition
This is where the Ottawa market matters. If you’re selling in a neighbourhood where most competing homes have renovated kitchens, updated bathrooms and finished basements, an original home may need to be priced differently.
On the other hand, if homes in your area are generally similar in age and condition, spending heavily to make yours the most renovated house on the street may not make financial sense.
Presentation Can Be More Important Than Renovation
A home doesn’t need to be brand new to show well. Professional staging, great photography, fresh paint, good lighting and removing excess furniture can completely change how buyers perceive a property.
Sometimes a few thousand dollars spent preparing and presenting a home properly can have a greater impact than a much larger renovation. Keep in mind that our team will help you along the way to make sure you are making the right decisions. We have a great staging team!
Talk to a Realtor Before You Renovate
This is probably our biggest piece of advice. If you’re planning to sell within the next year or two, have a Realtor look at the property beforeyou start spending money. We can compare your home with recent sales, look at your competition, and identify which improvements are likely to make a difference.
You may discover that the $30,000 renovation you were considering isn’t necessary at all.
When you’re preparing to sell, the goal isn’t to make your home perfect. The goal is to spend money where buyers are most likely to notice it — and avoid spending it where they won’t.
You listed your home expecting showings and offers. Instead, a few weeks have passed, activity has slowed down and you’re starting to wonder, why isn’t my house selling?
There usually isn’t just one reason, but after years of selling homes in Ottawa, we’ve found that most situations come back to a few key factors.
The Price
Let’s start with the obvious one. If buyers are viewing comparable homes but consistently choosing something else, your asking price may be part of the problem.
Today’s buyers have access to an incredible amount of information. They’re looking at listings every day, receiving notifications when new properties hit the market and comparing your home against everything else available. They generally know when something feels expensive. In our market now buyers wont buy unless they feel they are getting good value.
That doesn’t necessarily mean you need a huge price reduction. But if the market is consistently telling you that your home isn’t competitive, it’s worth listening.
The Presentation
Buyers often decide whether they’re interested in a home before they ever walk through the front door. Your photos, staging and online presentation matter.
Dark photography, cluttered rooms or an exterior that doesn’t photograph well can cause buyers to skip over a perfectly good house. You only get one opportunity to make that first impression.
The Competition Changed
Your home doesn’t exist in a vacuum. Maybe your price made sense when you listed, but three similar homes have since come onto the market at lower prices. Or perhaps another seller reduced their price and suddenly became your biggest competition. A good pricing strategy needs to respond to what’s happening around you.
You’ve Been on the Market Too Long
The first days and weeks of a listing are important because that’s when your home is new. Buyers who have been waiting for something like your property will see it almost immediately.
As time passes, that pool of buyers gets smaller. Eventually, buyers may start asking what’s wrong with the house simply because it has been available for a while.
That’s why it’s important to recognize when something isn’t working and make adjustments rather than simply waiting.
Sometimes the Market Is Just Slow
Not every problem is the house. Interest rates, inventory levels, economic uncertainty, holidays and even the time of year can affect buyer activity. There will be periods when excellent homes simply take longer to sell. The important thing is understanding whether the entire market is slow or just your listing.
What Should You Do?
Start with the data. Look at what’s sold since you listed. Look at what’s currently competing with you. Review showing activity and, most importantly, listen to Realtor. Sometimes something needs to change!
Could be that its the price. Sometimes it’s presentation or marketing. Sometimes patience really is the right strategy.
But if your home isn’t selling, doing the exact same thing for another month and hoping for a different result usually isn’t the best plan.
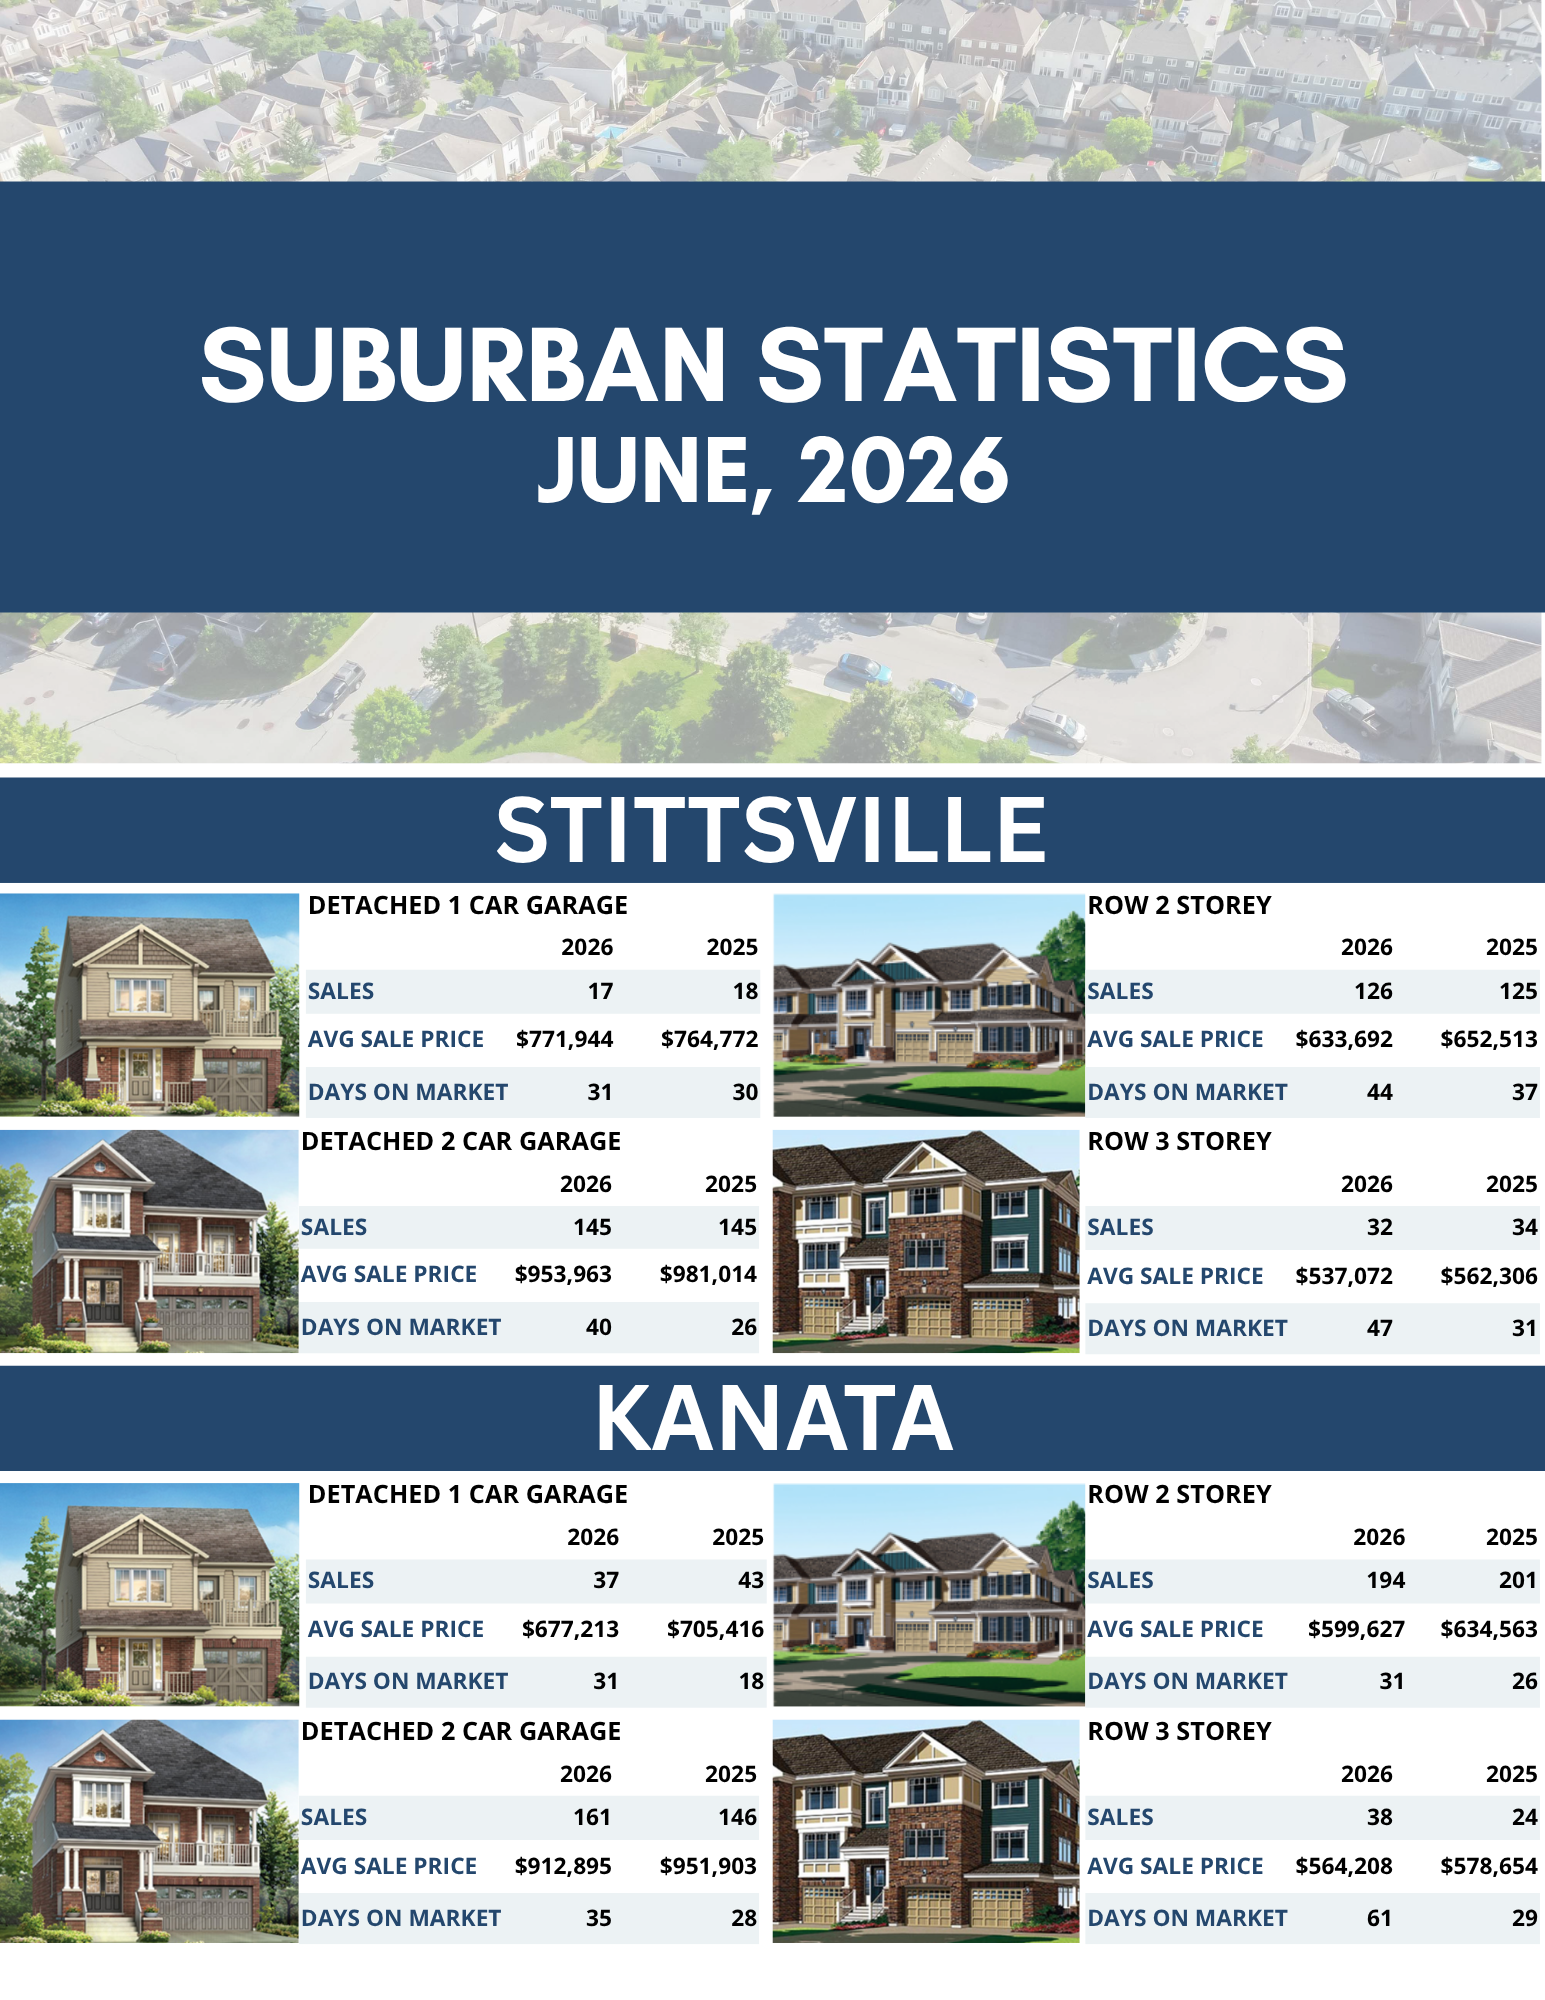
Ottawa’s real estate market continues to tell a different story from one neighbourhood to the next. While city-wide statistics provide a useful snapshot, sales activity, pricing trends, and buyer demand can vary significantly across individual communities.
In this August edition of our Suburban Statistics Series, we’re taking a closer look at five of Ottawa’s major suburban markets to see how each has performed so far in 2026. Using MLS® sales reported through OREB, we’ve compared activity from January 1 to August 31, 2026, with the same period in 2025 to highlight the trends taking shape across Ottawa’s suburban communities.
Ottawa’s real estate market is anything but uniform. In this edition of our Suburban Statistics Series, we’re examining how the city’s five largest suburban neighbourhoods are performing and where trends are emerging. The data below compares OREB MLS sales from January 1 through July 1, 2026, to the same period in 2025. It also captures the strongest year-over-year jump in sales activity we’ve seen in 2026.
The Ottawa housing market continued its slow but steady spring climb in May. Sales improved compared to April, buyers were more active, and homes that were priced properly continued to attract attention. However, we’re still seeing a very different market than we experienced during the spring rushes of the past few years.
If I had to summarize May in one sentence:
The market is healthy, but buyers are playing it safe and are taking their time.
Sales Picked Up, But Remain Behind Last Year
A total of 1,616 homes sold in Ottawa during May, up from 1,336 in April. That’s the seasonal increase we typically expect as the weather improves and more buyers begin shopping. However, sales were still down 10.6% compared to May of last year.
This isn’t because buyers have disappeared.
We’re still seeing plenty of showings, offers, and successful sales. The difference is that buyers have become more selective. They’re comparing more homes, negotiating harder, and are less willing to overlook pricing mistakes.
For sellers, this means preparation and pricing matter more than ever.
Inventory Continues to Grow
One of the biggest stories of 2026 remains inventory. Ottawa finished May with nearly 5,000 active listings, roughly 12% more than this time last year.
For buyers, that’s good news.
There are more homes to choose from, less pressure to make rushed decisions, and fewer situations where buyers feel forced into competing offers. For sellers, it means standing out has become increasingly important. Homes that are priced correctly and marketed properly continue to sell. Homes that miss the mark often sit longer and require price adjustments.
Home Prices Remain Remarkably Stable
Despite slower sales and increased inventory, prices have held up surprisingly well.
The average home sold for $721,270 in May, while the median sale price reached $660,000. Both figures were only slightly below where they were a year ago.
This is important because it highlights something we’ve been talking about for months: Ottawa is not experiencing a market correction. Instead, we’re seeing a normalization.
The frantic pandemic-era market is behind us, but strong population growth, stable employment, and relatively affordable housing compared to Toronto and Vancouver continue to support values.
Not All Property Types Are Performing the Same
The biggest mistake someone can make right now is looking at one city-wide statistic and assuming it applies to every home. We talk about this in our podcast. Ottawa is the most spread out major city in Canada. There are lots of different dynamics at play depending on the neighbourhood. With central locations being extremely active.
Single-Family Homes Continue to Lead
Detached homes remain the strongest segment of Ottawa’s market.
Benchmark pricing was slightly higher than last year, and median prices actually increased.
Townhomes Are Seeing More Competition
Townhomes remain popular, particularly with first-time buyers and military families, but increased inventory has created more competition. New builds took a huge chunk out of this segment in April and May. Leading to downward pressure on prices in this segment where builders have inventory: Kanata/Stittsville, Barrhaven.
Sales were down compared to last year, and pricing softened modestly. This isn’t a major concern, but it does mean sellers need to be realistic when setting expectations. Also, finding end units are selling much better than middle units in this segment.
Condos Remain the Softest Segment
Apartment-style condominiums continue to face the most pressure.
Higher carrying costs, increased inventory, and reduced investor demand have created a more challenging environment for condo sellers. Some of the older buildings’ condo fees are a runaway train! Buyers, have lots of choice in this segement. Getting a good deal is paramount.
What We’re Seeing on the Ground
Statistics are helpful, but they only tell part of the story.
What we’re seeing day-to-day is:
📈 Well-priced homes are still selling quickly, especially with the Chris Scott Team 🙂
🏡 Updated, move-in ready properties continue to outperform
💰 Buyers are negotiating more often than they were a year ago and walking from deals
📋 Conditional offers are becoming increasingly common
⏳ Overpriced homes are sitting longer and often selling after reductions
In many ways, this is what a healthy market looks like.
Neither buyers nor sellers have complete control, and success comes from strategy rather than simply relying on market momentum. In one word its BALANCED
What Happens Next?
As we move into summer, there are a few key indicators I’ll be watching closely:
● Inventory levels
● Days on market- our board will have more accurate numbers on this with new system
● Sale-to-list price ratios
● Interest rate decisions – I predict variables to lower. Maybe slightly on fixed too
● Employment trends – Public service will be the one to watch.
● New housing supply entering the market
If buyer confidence improves and inventory remains manageable, Ottawa should continue to see stable pricing through the second half of the year.
My Take
May was another reminder that Ottawa remains one of Canada’s most stable real estate markets.
We’re not seeing runaway price growth, but we’re also not seeing significant declines. Instead, we’re seeing a balanced market where buyers have options, sellers can still achieve excellent results, and strategy matters more than timing.
If you’re thinking about buying or selling this year, the biggest advantage isn’t trying to predict the market, it’s understanding your specific neighbourhood, property type, and competition. And that’s where local knowledge makes all the difference.
If you’d like to know what’s happening specifically in your neighbourhood, reach out anytime. We’re always happy to provide a personalized market update for your area.