FAIRWINDS QUARTLEY REPORT
Spring is in the air! Especially when it comes to the Fairwinds real estate market.
In the first 90 days of 2017, I have observed a significant growth in the number of real estate transactions in Fairwinds compared to last year.
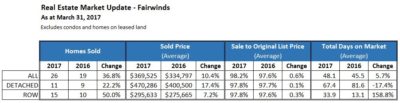
So far this year 26 homes have sold compared to 19 in the same period last year.[i] That is an increase of 36.8%. The average sale price has also gone up from $334,797 to $369,525, a 10.4% increase. While townhouses are the most sought-after style of housing at this time, detached homes are experiencing the greatest increase in average sale price, having experienced a 17.4% jump when compared to the same time last year.
What might this mean for the next couple of months of real estate transactions?
If you have been considering selling your home in 2017 now is the ideal time to offer it to the market. There are only six homes currently on the Ottawa Real Estate Board MLS® System[ii] and in March alone eight homes sold.
Highlights
- Homes Sold
- 26 – all (↑ 36.8%)
- 11 – detached (↑22.2%)
- 15 – row and semi-detached (↑ 50.0%)
- Sold Price
- $369,525 all (↑ 10.4%)
- $470,286 detached only (↑ 17.4%)
- $295,633 row and semi-detached (↑ 7.2%)
- Total Days on Market
- 1 detached and row & semi-detached combined (↑ 5.7%)
- 4 days for detached (↓ 17.4%)
- 9 for row and semi-detached (↑ 158.8%)
- Sale to Original List Price
- 98% (rounded) across the all types and for both years (↔ no significant change)
[i] Excludes condominiums and homes on leased land
[ii] All data courtesy of the Ottawa Real Estate Board MLS® System