2019 YEAR END REAL ESTATE MARKET UPDATE FOR STITTSVILLE
STITTSVILLE HOUSING MARKET 2019 IN REVIEW
Homes sold in Stittsville 2019

What a year 2019 turned out to be. Stittsville is becoming one of the most sought after communities in the city. Our MLS sales increases year over year were higher than any other neighbourhood in the city. People are catching on that Stittsville is an amazing place to live.
In total, 581 homes were sold in Stittsville in 2019, the highest sale volume in ten years. Listings are selling quickly, at just 23 days on market.
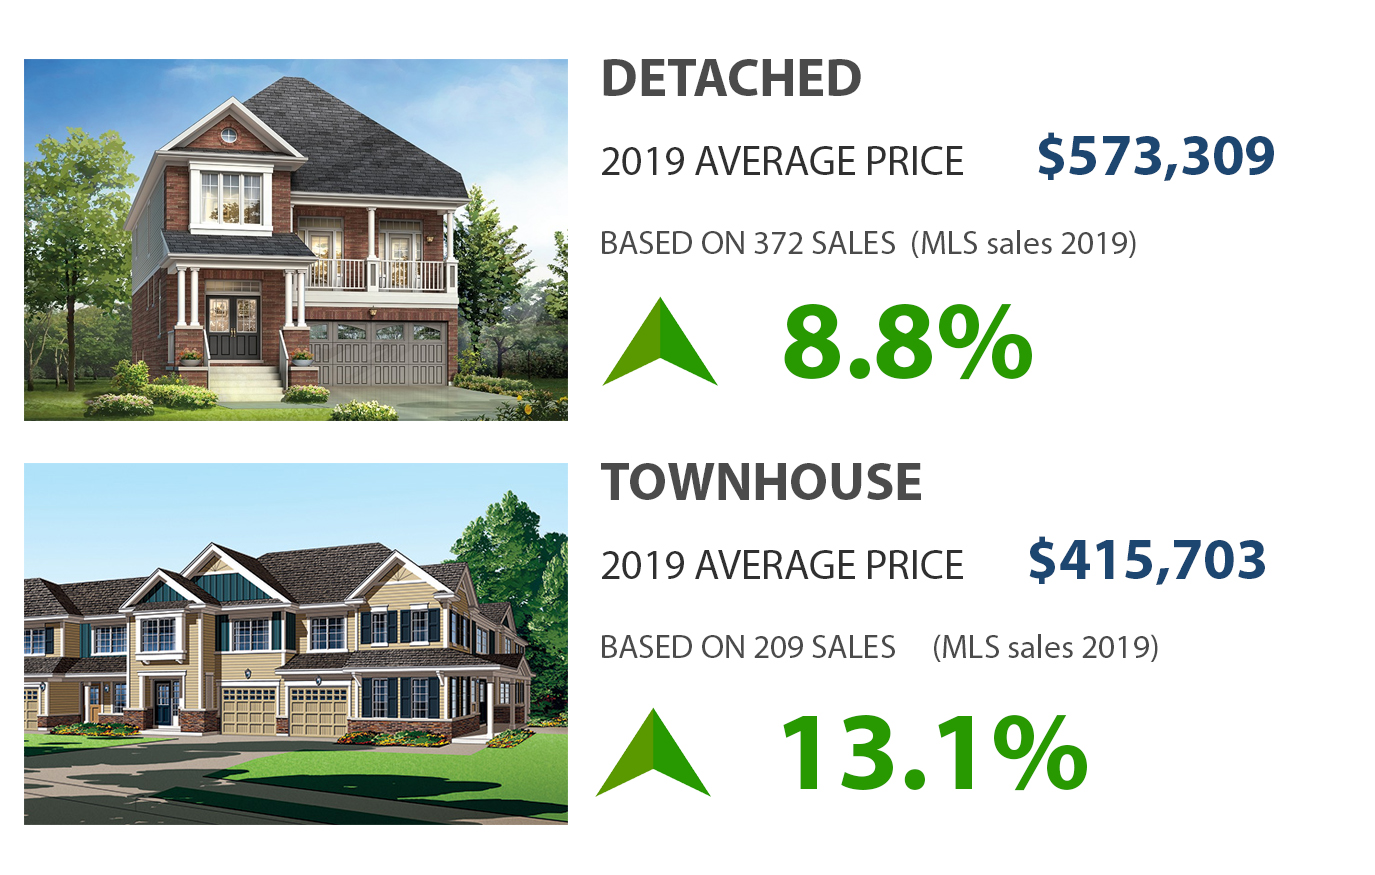
Not only are homes selling quickly, about one third sold for more than the listed. The average price of a home sold in Stittsville in 2019 was $516,711, up 9% over last year. The increase is most notable in the row/semi-detached category where the average price was $415,703 compared to $573,309 for a detached home.
If you are curious about your Stittsville’s home value please fill in this form for a no-obligation market assessment.
FORECAST 2020
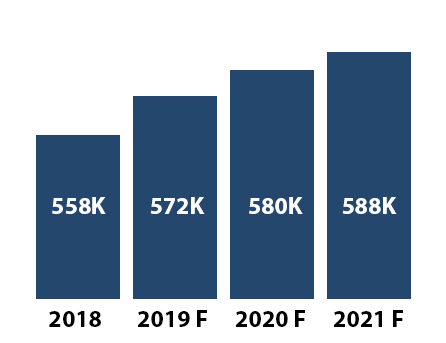
The Ottawa real estate market is showing no signs of weakness. Supply issues will persist in 2020. I don’t expect the inventory will recover in the near future. The absorption rate of our current inventory is like nothing we have seen before! Prices are expected to continue to grow over the upcoming few years. The demand for our real estate is at an all-time peak. This trend will continue to put upward pressure on prices throughout the next few years. Although prices are going up relative to our income we are actually still in a sustainable position. Prices in Ottawa, when compared with our earnings, are still affordable.

Below you can see a table of real estate prices in Ottawa since 1981. The only declining years are in red. The table illustrates just how stable our market is. The only declines were consecutive (94-96) and houses lost less than 3% in each of those years. If you were at a craps table and saw this much black on the board how much money would you be prepared to invest. If you are a long term investor it would be pretty hard to find a scenario where you could lose.
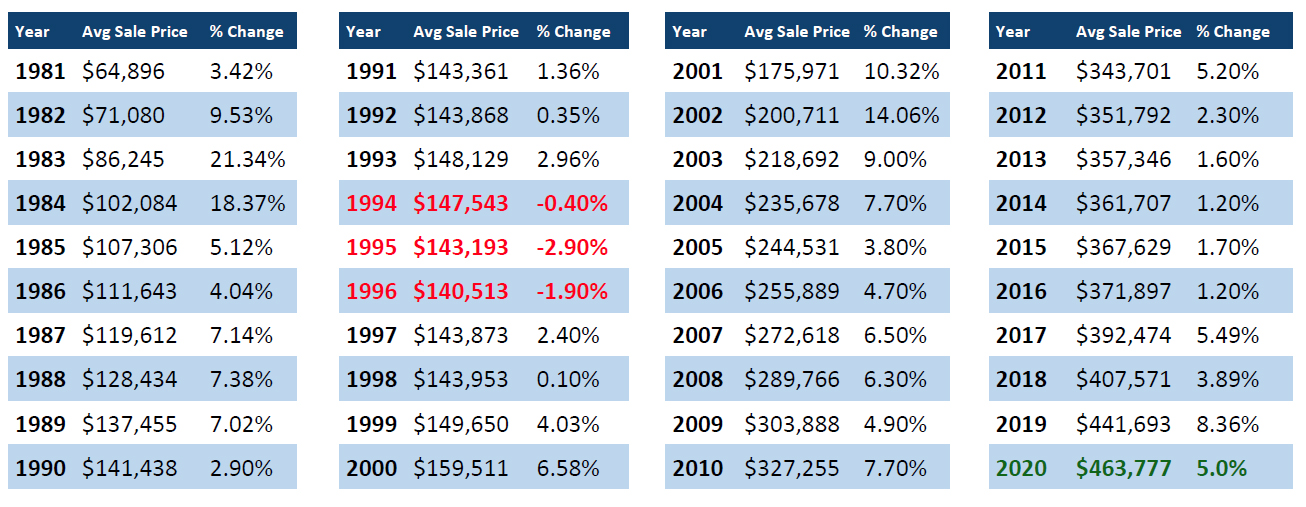
Based on OREB RES & CON MLS Sales | 2020 Prediction
KEY INDICATORS
|
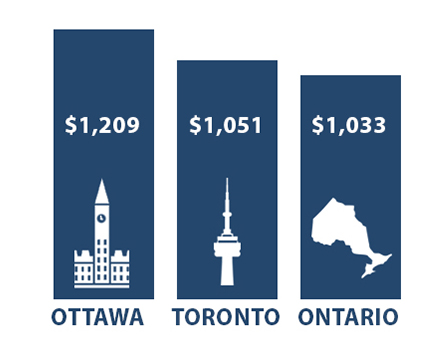
OTTAWA: RELATIVELY HIGHER EARNINGS
|
Ottawa’s solid public sector is a great foundational piece of our economy. This represents 20% of the workforce in Ottawa. These jobs are high earnings with very good security. When I think of my own network of friends, almost every couple has at least one person working for the government. In some cases, both spouses work there and this creates some very high household income. This past year saw a 6.9% increase in our weekly average income. We have not seen that kind of income growth in Ottawa since 2001. When we see our earnings higher than our neighbours down the 401, it surprises some people. Of course with the financial sector in Toronto, there is more wealth and one-percenters. Ottawa just does a better job with the distribution of wealth.
|
|
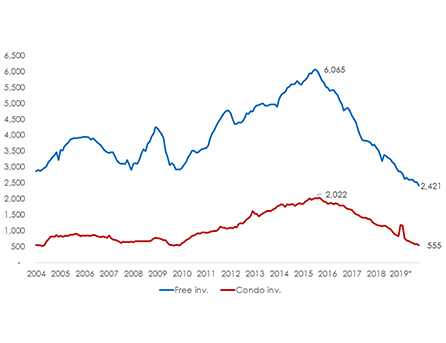
SUPPLY TRENDS LOWER FOR FREEHOLDS & CONDO
|
Supply is the single biggest issue in our market. It is so interesting to see where we are from an inventory perspective when compared to the last 15 years. We are at the lowest point in both the condo and the freehold segment of the market. Look at the condos available in 2015! Over 6000 on the market. This is the heartbeat of the market. When we see inventory this low, prices can only go in one direction! The little secret I have been telling people about Ottawa’s bargain real estate prices is out! Our market is on fuego.
|
|
STEADY EMPLOYMENT GROWTH EXPECTED
|
The local economy and job market in Ottawa are solid. Steady job growth is expected to continue over the next few years. It is good to see that full-time job growth is up 5%. This is important because people that occupy full-time jobs are much more likely to be approved financially to purchase real estate. Our capital city also is one of the hottest and most diverse tech hubs in North America. Overall the health of our local economy couldn’t be better. |
HIGHLIGHTS
STITTSVILLE HOUSING MARKET 2019 IN REVIEW
Homes Sold – All 2019
- 581 – all (↑ 11.1%)
- 372 – detached (↑ 7.8%)
- 209 – row & semi-detached (↑ 17.4%)
Sold Price – 2019 Average
- $516,711 – all (↑ 9.3%)
- $573,309 – detached (↑ 8.8%)
- $415,703 – row & semi-detached (↑ 13.1%)
Total Days on Market – 2019 Average
- 23 – all (↓ 17.9%)
- 27 – detached (↓ 22.9%)
- 13 – row & semi-detached (↓ 18.8%)
Active Listings – 2019 Monthly Average
- 42.4 – all (↓ 16.3%)
- 33.8 – detached (↓ 19.8%)
- 8.6 – row & semi-detached (↑ 1.0%)
Months of Inventory – 2019 Monthly Average
- 1.1 – all (↓ 18.8%)
- 1.2 – detached (↓ 36.4%)
- 0.5 – row & semi-detached (↔ 0.0%)
[1] Excludes condominiums, homes on leased land and homes under construction.
[2] Total days on market includes all days from listing date and firm sale date of the property.
[3] All data courtesy of the Ottawa Real Estate Board MLS® System. The above information is believed to be accurate but warranted.

