STITTSVILLE HOUSING MARKET UPDATE, APRIL 2019
Homes sold in Stittsville, April 2019

There is no secret that Ottawa has a supply issue. Housing inventory remains at record low levels. This has put upward pressure on prices in Stittsville and other locations across the city. Sellers are hesitant to put their houses for sale because there is not much to purchase on the other side. It has created a bit of a catch 22. This low inventory appears to be a trend likely to continue for the foreseeable future.
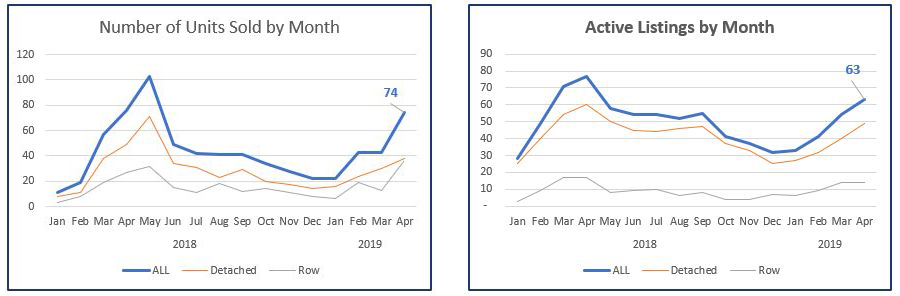
While April saw the most new listings hit the market in 2018, April 2019 was a little soft in that regard. As such, a total of 74 homes sold in Stittsville last month, very similar to the number of sales in April 2018. The lack of supply has created a record number of bidding wars in Stittsville so far this year. This creates new highs for prices that new sellers are relying on when pricing their own homes. This can lead to rapid price acceleration. I have seen it first hand. Especially in the red hot townhouse sector. This is great news for sellers but sellers are typically buyers too. They are buying into the same market. There is a lot to navigate this year for sure. If you are looking for expert advice feel free to get in touch.
If you are curious about your Stittsville’s home value please fill in this form for a no-obligation market assessment.
HIGHLIGHTS
Homes Sold in April 2019 Compared to April 2018
- 74 – all (↓ 2.6%)
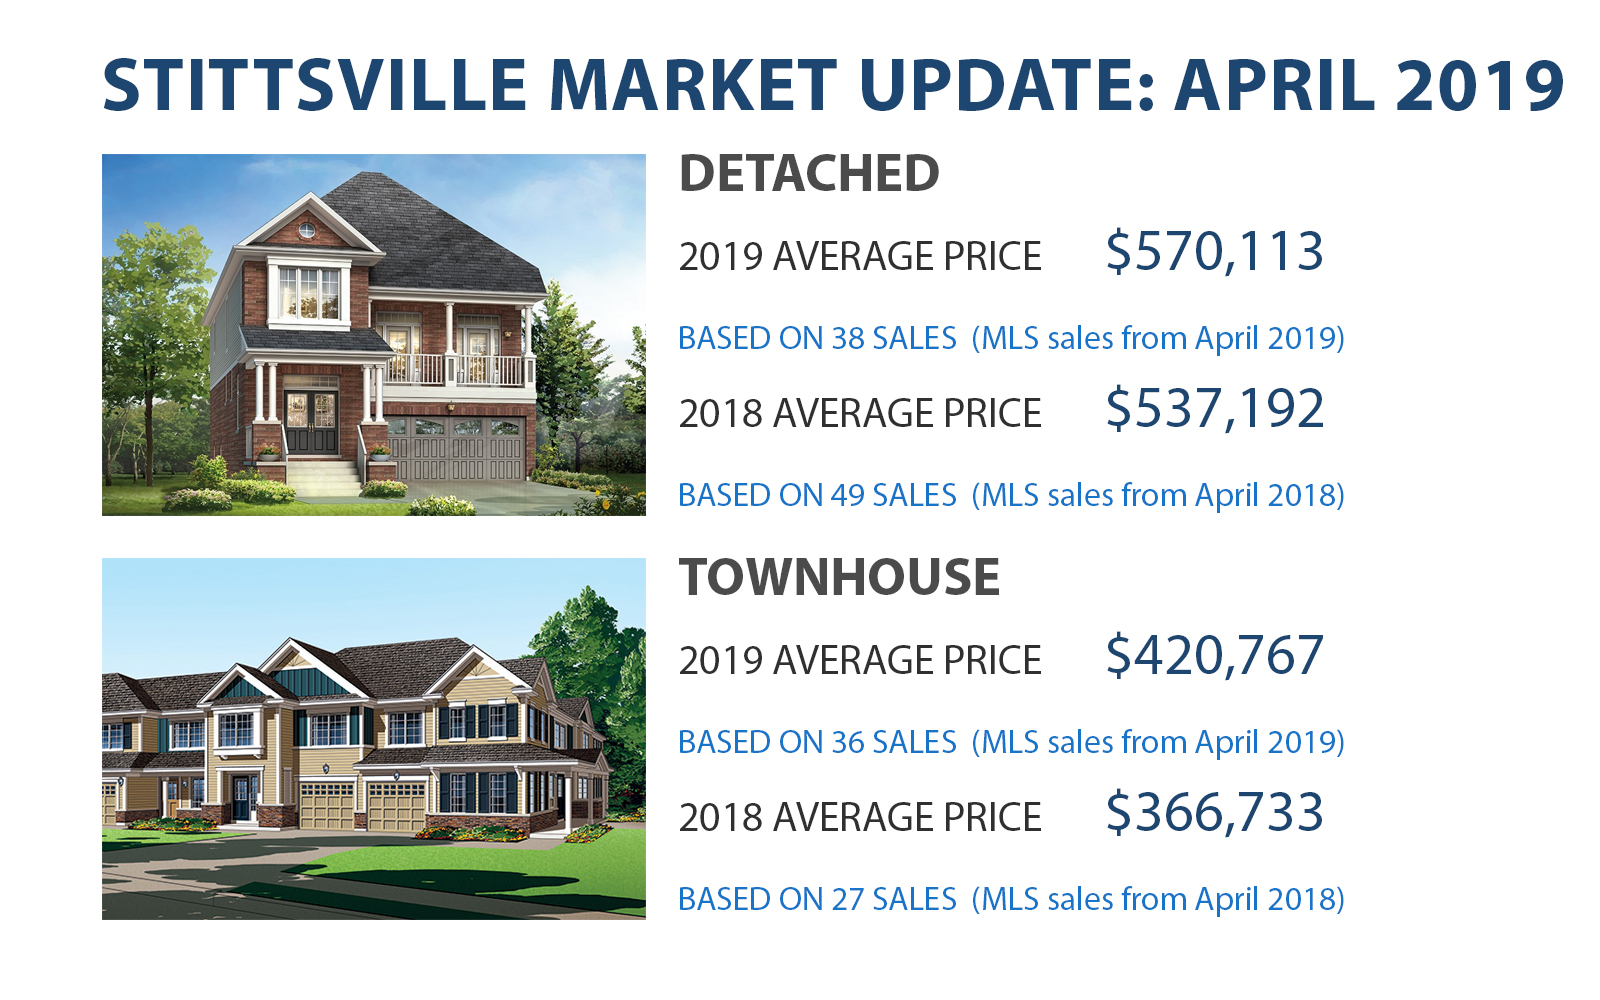
- 38 – detached (↓ 22.4%)
- 36 – row & semi-detached (↑ 33.3%)
Average Sold Price in April 2019 Compared to April 2018
- $497,458 – all (↑ 4.4%)
- $570,113 – detached (↑ 6.1%)
- $420,767 – row & semi-detached (↑ 14.7%)
Average Total Days on Market in April 2019 Compared to April 2018
- 25 – all (↑ 47.1%)
- 36 – detached (↑ 89.5%) [1]
- 11 – row & semi-detached (↓ 26.7%)
Active Listings in April 2019 Compared to April 2018
- 63 – all (↓ 18.2%)
- 49 – detached (↓ 18.3%)
- 14 – row & semi-detached (↓ 17.6%)
Months of Inventory in April 2019 Compared to April 2018
- 1 – all (↔ 0.0%)
- 1 – detached (↔ 0.0%)
- 0 – row & semi-detached (↓ 100.0%)