STITTSVILLE HOUSING MARKET UPDATE, AUGUST 2019
STITTSVILLE HOUSING MARKET UPDATE AUGUST 2019
Homes sold in Stittsville, August 2019

Stittsville remains one of the most desirable communities in Ottawa to live. Demand for housing here is at an all-time high. In the month of August, a total of 51 homes sold in Stittsville, this is up almost 25% when compared to August 2018. Interesting numbers considering we have a very low inventory of homes available. There is less than 1 months worth of inventory right now in most neighbourhoods.
Much of the activity right now continues to be in the row-unit segment of the market. In this segment, you have investors, empty nesters, and first-time buyers competing to purchase. This has put upward pressure on prices. Over 11% when you compare last months numbers to 2018. The average price is now $422,311 This has been increasing monthly. There are townhomes that sold in March for $400k that would be $415-420k now. Multiple offers have been the norm in this segment for well priced and presented homes.
Every neighbourhood is very different. Fairwinds will have its own market trends when compared to say Granite Ridge or Jackson Trails. If you would like to know your equity position please get in touch. We know Stittsville!
If you are curious about your Stittsville’s home value please fill in this form for a no-obligation market assessment.
HIGHLIGHTS
STITTSVILLE HOUSING MARKET UPDATE AUGUST 2019
Homes Sold in August 2019 Compared to August 2018
- 51 – all (↑ 24.4%)
- 32 – detached (↑ 39.1%)
- 19 – row & semi-detached (↑ 5.6%)
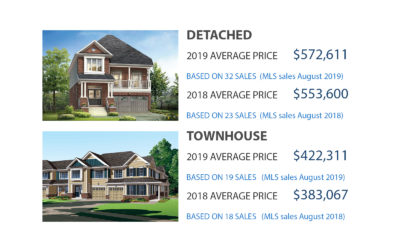
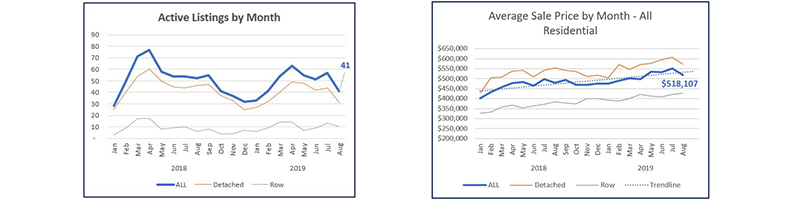
Average Sold Price in August 2019 Compared to August 2018
- $518,107 – all (↑ 8.2%)
- $572,611 – detached (↑ 3.4%)
- $422,311 – row & semi-detached (↑ 11.3%)
Average Total Days on Market in August 2019 Compared to August 2018
- 28 – all (↓ 3.4%)
- 32 – detached (↓ 13.5%)
- 22 – row & semi-detached (↑ 4.8%)
Active Listings in August 2019 Compared to August 2018
- 41 – all (↓ 21.2%)
- 31 – detached (↓ 32.6%)
- 10 – row & semi-detached (↑ 66.7%)
[1] Excludes condominiums, homes on leased land and homes under construction.
[2] All data courtesy of the Ottawa Real Estate Board MLS® System. The above information is believed to be accurate but not warranted.