STITTSVILLE HOUSING MARKET UPDATE, JANUARY 2020
STITTSVILLE HOUSING MARKET UPDATE JANUARY 2020
Homes sold in Stittsville, January 2020
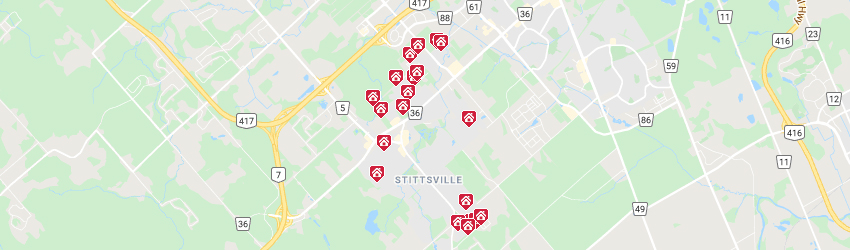
The 2020 real estate market in Stittsville started out with very few homes available for sale. It is as tight as our market has ever been. The newest listings sold very quickly, most often in less than two weeks. Many are selling for well above their asking prices. It has been interesting to see the fluctuation in some of the sales. There are some outlier sales in the market. Sales that some buyers are going “all in” on during the multiple offer situations. One last week I saw sell well above the same model that sold the week before in the townhouse segment. This tells me that some buyers are getting desperate. The bidding is essentially a blind process so in that case it is possible that the buyer paid thousands more than the next buyer. House was listed at $449k and sold for $507k.
In January, a total of 20 homes sold in Stittsville, down from January 2019.
The average sale price for homes sold last month was $529,753, representing an increase of nearly 12% over the same month last year and only slightly lower than the average sale price of November and December 2019.
If you are curious about your Stittsville’s home value please fill in this form for a no-obligation market assessment.
HIGHLIGHTS
STITTSVILLE HOUSING MARKET UPDATE JANUARY 2020
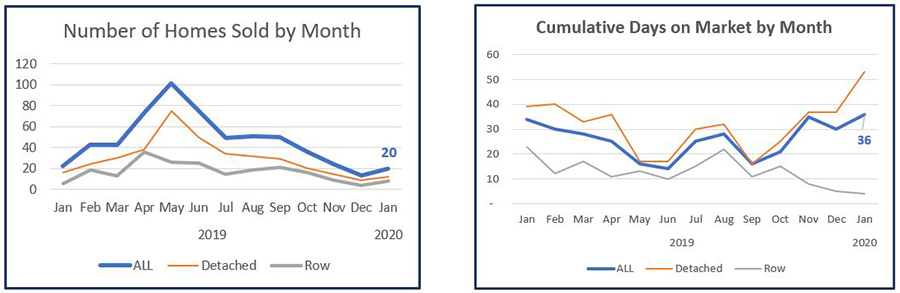
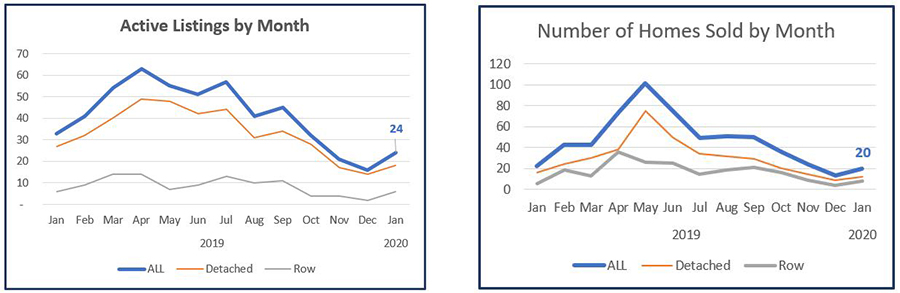
Homes Sold in January 2020 compared to January 2019
- 20 – all (↓ 9.1%)
- 12 – detached (↓ 25.0%)
- 8 – row & semi-detached (↑ 33.3%)
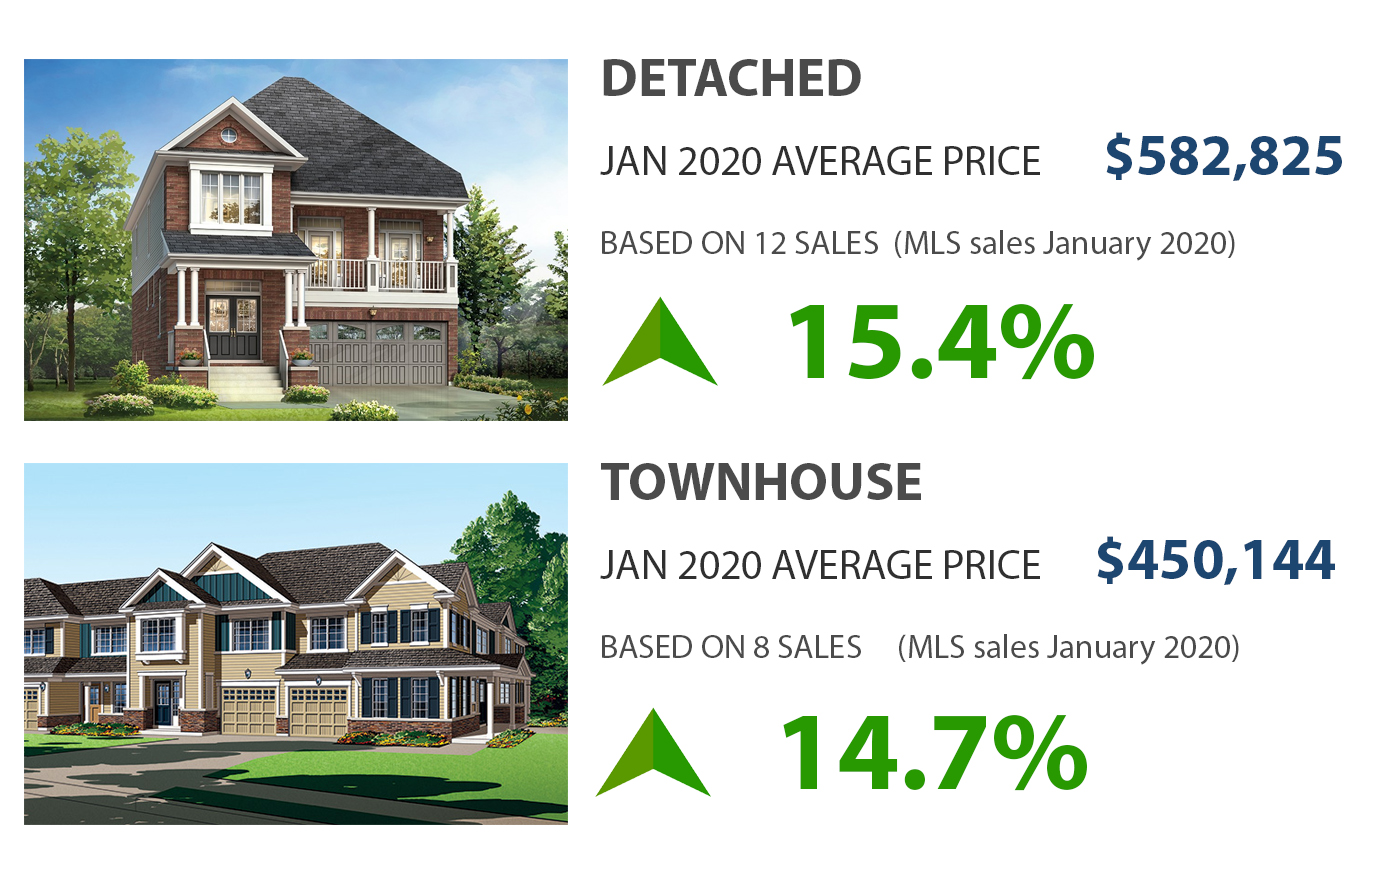
Average Sold Price in January 2020 compared to January 2019
- $529,753 – all (↑ 11.7%)
- $582,825 – detached (↑ 15.4%)
- $450,144 – row & semi-detached (↑ 14.7%)
Average Total Days on Market in January 2020 compared to January 2019
- 36 – all (↑ 5.9%)
- 53 – detached (↑ 35.9%)
- 4 – row & semi-detached (↓ 82.6%)
Active Listings in January 2020 compared to January 2019
- 24 – all (↓ 27.3%)
- 18 – detached (↓ 33.3%)
- 6 – row & semi-detached (↔ 0.0%)
Months of Inventory in January 2020 compared to January 2019
- 1 – all (↓ 50.0%)
- 2 – detached (↔ 0.0%)
- 1 – row & semi-detached (↔ 0.0%)
[1] Excludes condominiums, homes on leased land and homes under construction.
[2] All data courtesy of the Ottawa Real Estate Board MLS® System. The above information is believed to be accurate but not warranted.