STITTSVILLE HOUSING MARKET UPDATE, JULY 2019
STITTSVILLE HOUSING MARKET UPDATE JULY 2019
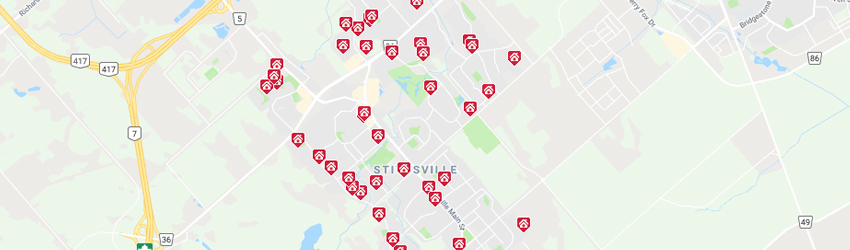
Homes sold in Stittsville, July 2019
The Stittsville real estate market continues to impress. We are very much in a sellers market. There is about 1 months worth of inventory right now. This has put pressure on Stittsville buyers. Often having to bid against others to secure a property. This pressure is really felt over all segments of the market. We had clients that had to compete against 2 other buyers to secure their dream house on Cypress Gardens. That was over 1M. In the entry-level segment, a buyer may have to compete against 4 or more buyers depending on the price and the location. The most active segment remains the row units. Lots of investors and first-time buyers in this segment.
Stittsville continues to be a sought after suburb to live. Prices are up in all segments over 10% when compared with last year. I see this trend continuing as we are dealing with low inventory levels. Every neighbourhood is different. If you want to know what is happening in your area feel free to reach out to our team.
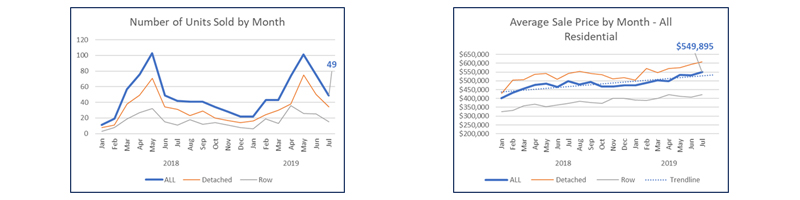
In the month of July, a total of 49 homes sold in Stittsville [1], up somewhat when compared to July 2018.
Similarly, the average sale price for homes sold last month is 10.5% higher than what it at the same time last year, $549,895, and slightly higher than the average sale price last month. This increase in the sale price is observed across all categories, even with the increase in offering over last month [2].
If you are curious about your Stittsville’s home value please fill in this form for a no-obligation market assessment.
HIGHLIGHTS
STITTSVILLE HOUSING MARKET UPDATE JULY 2019
Homes Sold in July 2019 Compared to July 2018
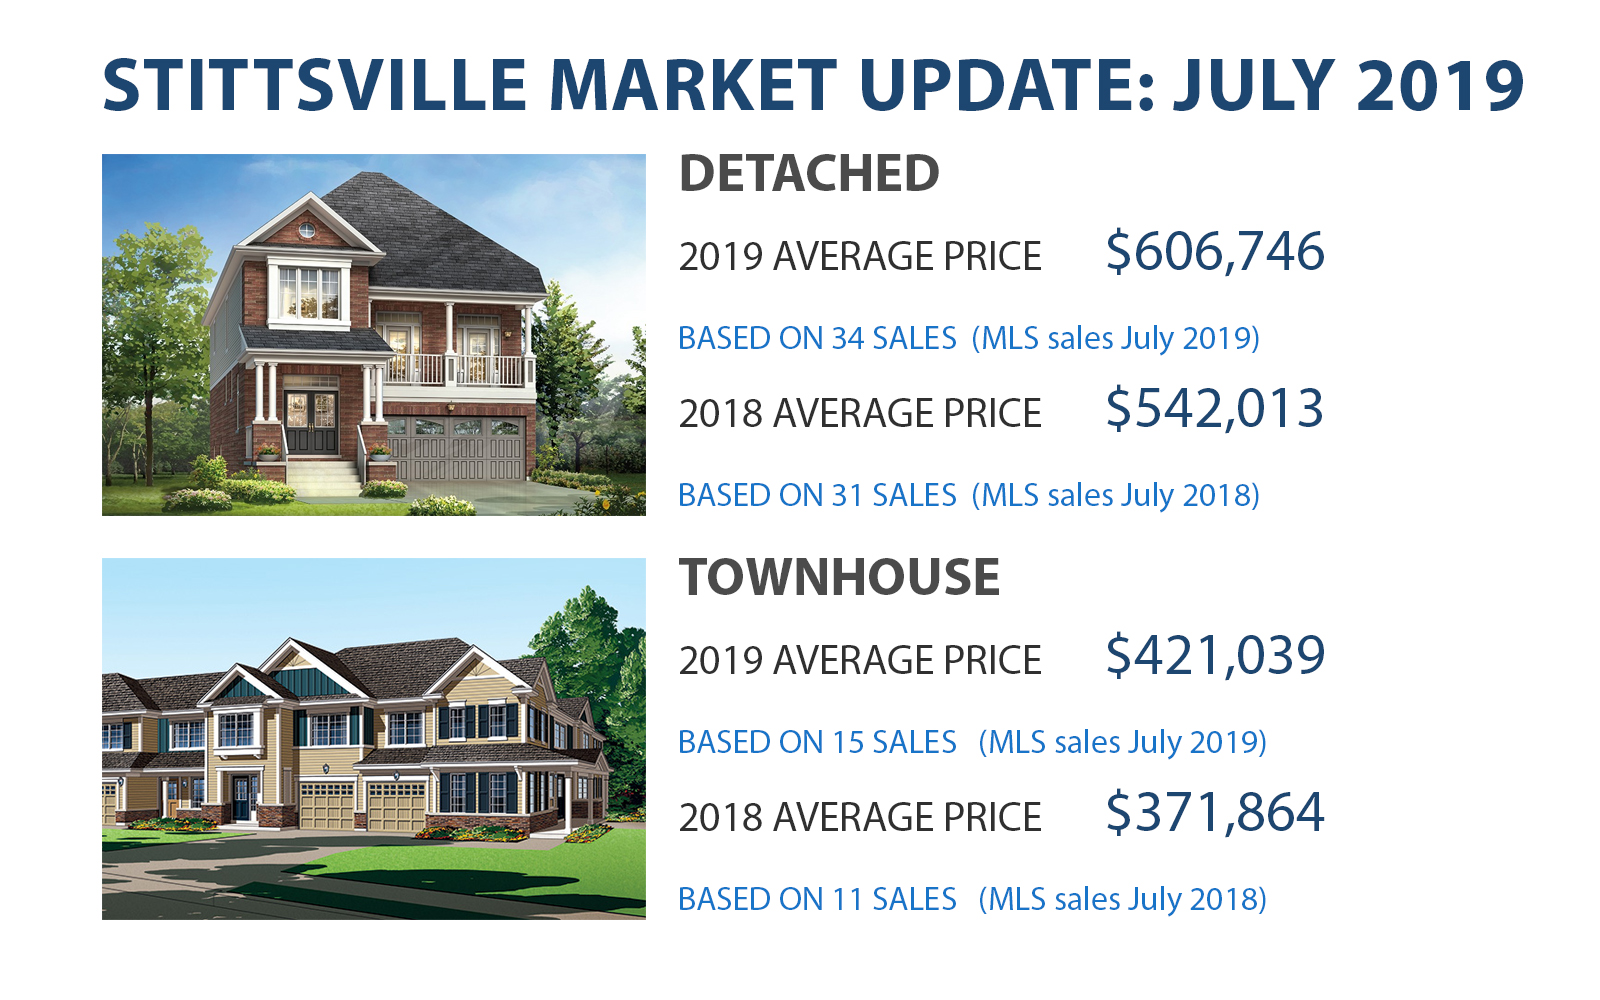
- 49 – all (↑ 16.7%)
- 34 – detached (↑ 9.7%)
- 15 – row & semi-detached (↑ 36.4%)
Average Sold Price in July 2019 Compared to July 2018
- $549,895 – all (↑ 10.5%)
- $606,746 – detached (↑ 11.9%)
- $421,039 – row & semi-detached (↑ 13.2%)
Average Total Days on Market in July 2019 Compared to July 2018
- 25 – all (↓ 44.4%)
- 30 – detached (↓ 28.6%)
- 15 – row & semi-detached (↓ 71.2%)
Active Listings in July 2019 Compared to July 2018
- 57 – all (↑ 5.6%)
- 44 – detached (↔ 0.0%)
- 13 – row & semi-detached (↑ 30.0%)
[1] Excludes condominiums, homes on leased land and homes under construction.
[2] All data courtesy of the Ottawa Real Estate Board MLS® System. The above information is believed to be accurate but not warranted.