STITTSVILLE HOUSING MARKET UPDATE, MARCH 2019
Homes sold in Stittsville, February 2019

Looking over the February 2019 real estate sales figures for the Stittsville market, it is clear that Seller’s Market conditions continue to prevail. The 5-year average for active listings in February is 88 listings compared to the actual number of 41 seen last month.
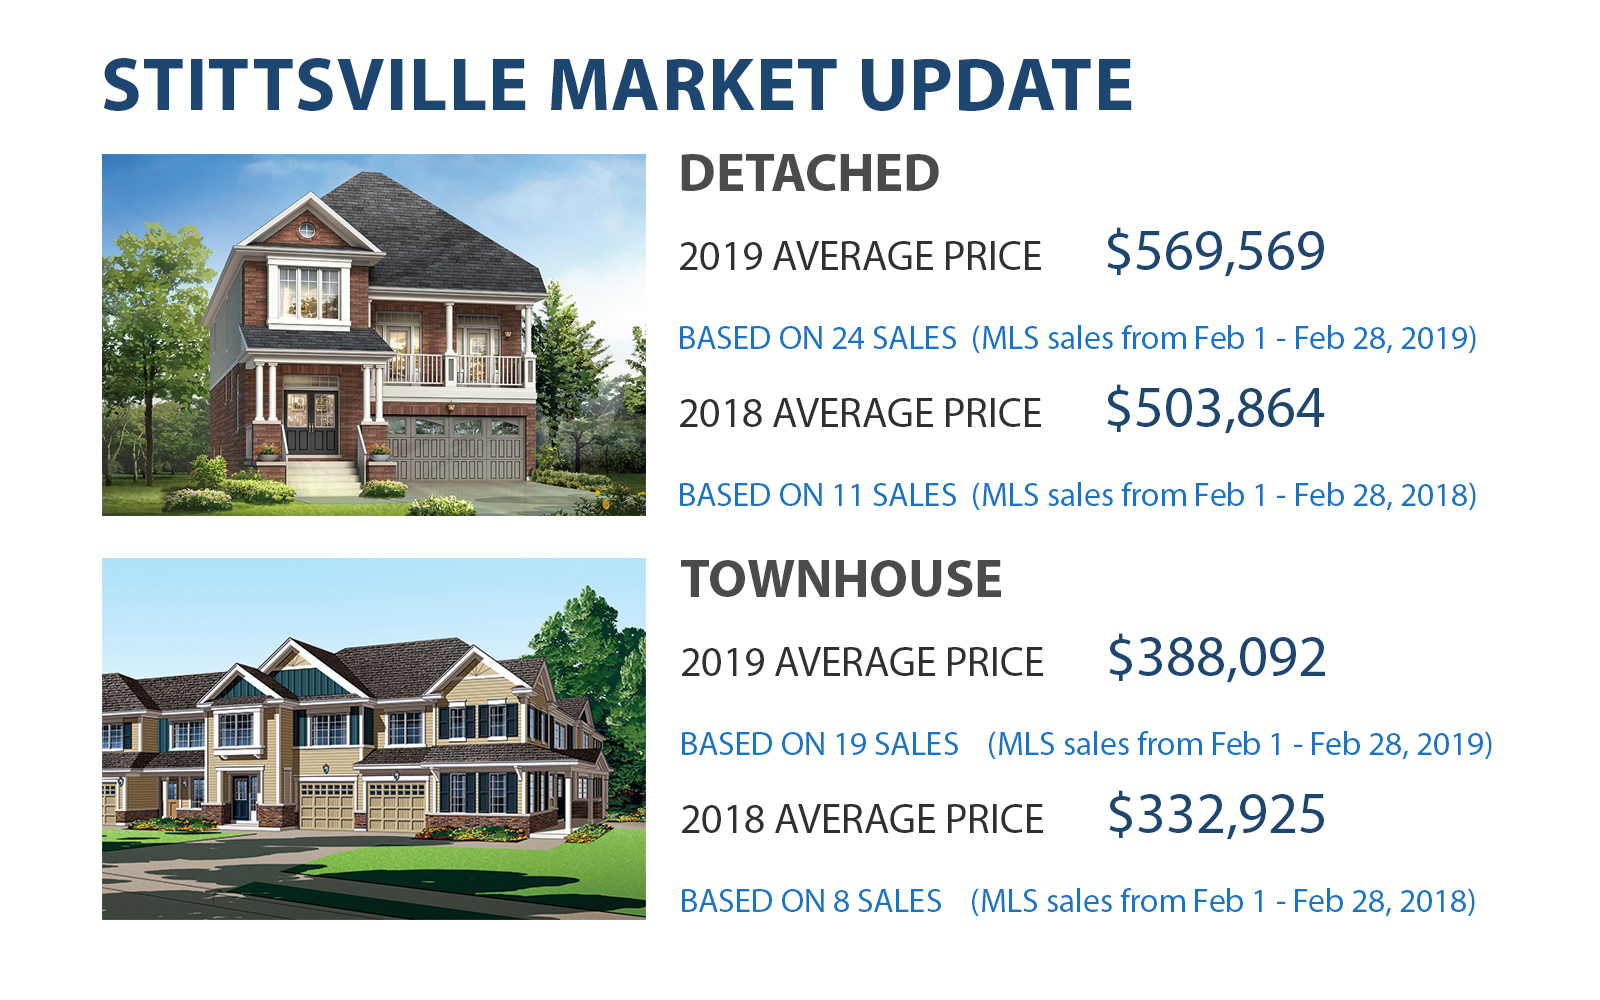
Also, 43 homes sold in Stittsville last month[1]. That figure is more than twice the number of homes sold in February last year and nearly equal to the total number of homes sold in December and January combined. This trend is surprising given that these sales are being completed with much fewer homes available to purchase. This will continue to put upward pressure on prices.
The average price of a residential-class property in Ottawa last month was $466,540. The condo market is also lacking inventory holds down an average price of $288,000, this is up 5.6% compared with February of last year.
In the big picture, Ottawa remains the most stable real estate market in North America. Historically we have always posted gains year to year and have weathered economic storms better than any other housing market. This year we are starting to see weakness in other market centres while Ottawa continues to thrive. This is because our housing is still relatively affordable considering our high household income averages. How long I will be about to tout about that is uncertain!
The average sale price for homes sold last month in Stittsville was $486,690. This is 13% higher than the same period last year and a continuation of the upward trend in prices over the last five months [2]. Buckle up Stittsville, we have another busy Spring market ahead!
Want to know the value of your home? Fill out our home evaluation form.
Home Evaluation

[1] Excludes condominiums, homes on leased land and homes under construction.
[2] All data courtesy of the Ottawa Real Estate Board MLS® System. The above Information is believed to be accurate but not warranted.

HIGHLIGHTS
Homes Sold Last Year Compared to Previous Year
o 43 – all (↑ 126.3%)
o 24 – detached (↑ 118.2%)
o 19 – row and semi-detached (↑ 137.5%)
Average Sold Price
o $489,396 – all (↑ 13.3%)
o $569,596 – detached (↑ 13%)
o $388,092 – row and semi-detached (↑ 16.6%)
Total Days on Market
o 30 – all (↑ 7.1%) 3
o 40 – detached (↑ 2.6%)
o 12 – row and semi-detached (↔ 0.0%)
Active Listings
o 41 – all (↓ 16.3%)
o 32 – detached (↓ 20.0%)
o 9 – row and semi-detached (↔ 0.0%)
Months of Inventory
o 1 – all (↓ 66.7%)
o 1 – detached (↓ 75.0%)
o 0 – row and semi-detached (↓ 100.0%)
[1] Excludes condominiums, homes on leased land and homes under construction.
[2] All data courtesy of the Ottawa Real Estate Board MLS® System. The above Information is believed to be accurate but not
warranted.
[3] Increase in CDOM is due to 3 homes that had been on the market for over 130 days that have finally sold.
