STITTSVILLE HOUSING MARKET UPDATE, OCTOBER 2019
STITTSVILLE HOUSING MARKET UPDATE OCTOBER 2019
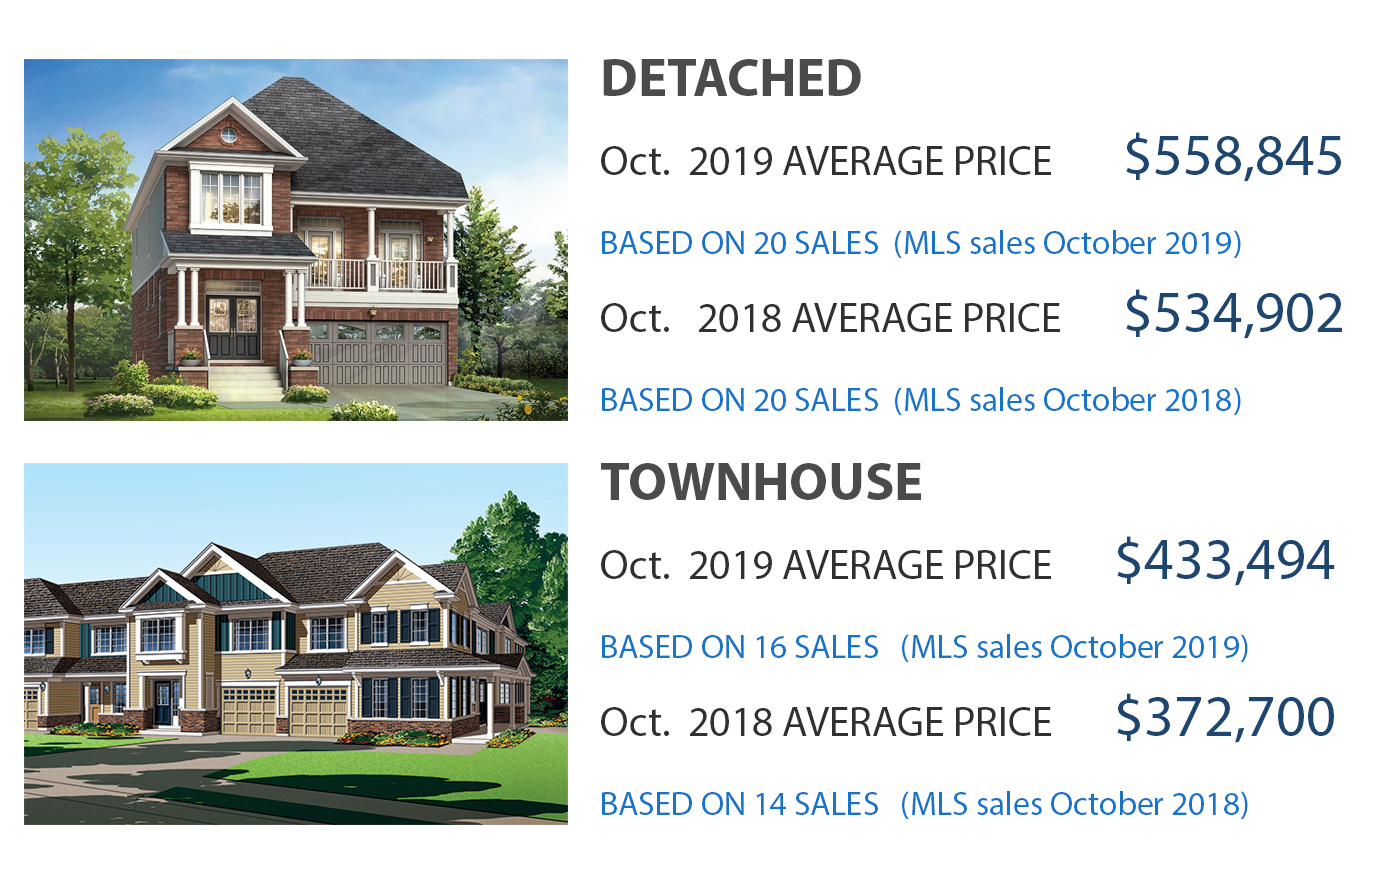
Homes sold in Stittsville, October 2019

The Stittsville real estate market continues to impress. The hottest segment of the market continues to be the townhouse segment. I have seen prices rise rapidly throughout this year. As buyers start paying larger premiums to secure townhomes. In the Fairwinds area, I have seen the same model of townhouse sell for around $410k in March and now it is in the $435k range. The increase in demand, decrease in supply, and the sheer desperation of some buyers has really helped push this up. There are also so many investors hungry to get into the market. It is something to keep an eye on. This rapid appreciation in this segment is not sustainable for much longer.
The detached market is not quite the same. It is a very strong seller’s market but buyers are not opening up their wallets as easily here. Prices are up a very solid 4.5%. There are just fewer buyers competing in this segment.
Ottawa continues to be at the top of the list of best places to live in Canada. We are in the best community of Ottawa so we are kind of like the best of the best! Our quality of life here is so good. It is why there continues to be so many people wanting to live here in Stittsville. Can’t blame them really 🙂
If you are curious about your Stittsville’s home value please fill in this form for a no-obligation market assessment.

HIGHLIGHTS
STITTSVILLE HOUSING MARKET UPDATE OCTOBER 2019
Homes Sold in October 2019 Compared to October 2018
- 36 – all (↑ 5.9%)
- 20 – detached (↔ 0.0%)
- 16 – row & semi-detached (↑ 14.3%)
Average Sold Price in October 2019 Compared to October 2018
- $503,133 – all (↑ 7.5%)
- $558,845 – detached (↑ 4.5%)
- $433,494 – row & semi-detached (↑ 16.3%)
Average Total Days on Market in October 2019 Compared to October 2018
- 21 – all (↓ 34.4%)
- 25 – detached (↓ 41.9%)
- 15 – row & semi-detached (↓ 16.7%)
Active Listings in October 2019 Compared to October 2018
- 32 – all (↓ 22.0%)
- 28 – detached (↓ 24.3%)
- 4 – row & semi-detached (↔ 0.0%)
Months of Inventory in October 2019 Compared to October 2018
- 1 – all (↔ 0.0%)
- 1 – detached (↓ 50.0%)
- 0 – row & semi-detached (↔ 0.0%)
[1] Excludes condominiums, homes on leased land and homes under construction.
[2] All data courtesy of the Ottawa Real Estate Board MLS® System. The above information is believed to be accurate but not warranted.