STITTSVILLE HOUSING MARKET UPDATE: Q1
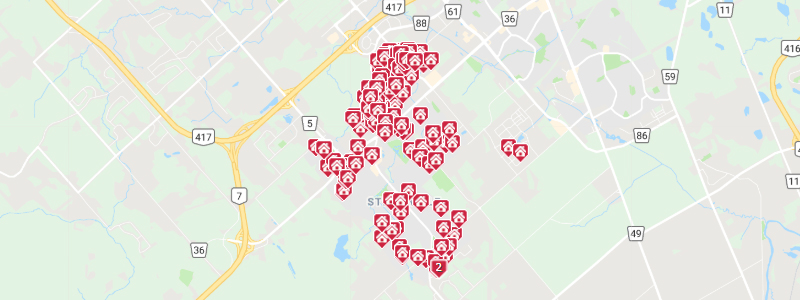
Homes sold in Stittsville, January 1, 2019 to March 31, 2019
If I were to describe our current real estate market in one word it would be BONKERS. I don’t use that word often but I think it is fitting. Some might even add in a curse word in front of it. This is good news for sellers. I have been saying for a few years that Ottawa’s prices, in general, are undervalued. The correction seems to be happening quickly. Houses have appreciated at the fastest pace I have seen over the past 6 months. Houses that were sold last year for $440-$450k in some cases I have seen them sell for 40k more only a year later. Every day I am surprised at some of the sale prices I am seeing.
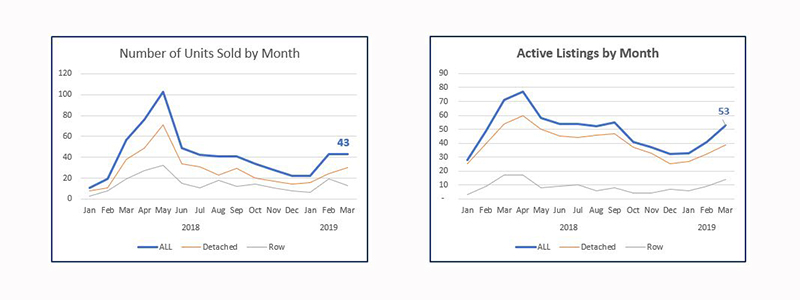
Stittsville continues to be a sought after place to buy real estate. Over the first three months of 2019, the number of active real estate listings in Stittsville dropped compared to the previous year, the number of sales rose by a significant 24% for a total of 108 homes sales [1].
The average sale price for homes sold this year to date was $488,553. This is nearly 14% higher than the same period last year and a continuation of the steady upward trend in prices since October 2018 [2].
And while it appears that the total days to sell a home is increasing, more than half of the homes offered to the market sold in less than 2 weeks. Some of them are only 2 weeks because offers were held for the first week.
Many homes are getting multiple offers when they list. I think it is very important to have a qualified Realtor guide you through this stressful and challenging scenario. There is lots of money at stake and I have seen owners try to do it themselves this Spring and leave lots of money on the table. You still need to have the house staged and ready, marketed properly, and ready for buyers. Then you can rely on the expertise of a Realtor to navigate you through our changing market.
Want to know the value of your home? Fill out our home evaluation form.
Home Evaluation
HIGHLIGHTS
Homes Sold in the First 3 Months 2019 Compared to First 3 Months 2018
o 108 – all (↑ 24.1%)
o 70 – detached (↑ 22.8%)
o 38 – row & semi-detached (↑ 26.7%)
Average Sold Price in the First 3 Months 2019 Compared to First 3 Months 2018
o $488,553 – all (↑ 13.7%)
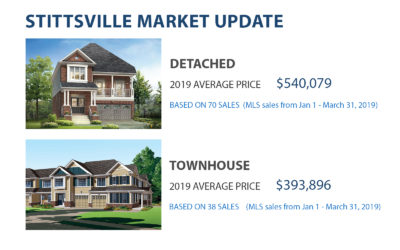
o $540,079 – detached (↑ 12.6%)
o $393,896 – row & semi-detached (↑ 16.3%)
Average Total Days on Market in the First 3 Months 2019 Compared to First 3 Months 2018
o 30.7 – all (↑ 13.6%)
o 37.3 – detached (↑ 10.9%)
o 17.3 – row & semi-detached (↑ 26.8%)
Active Listings in the First 3 Months 2019 Compared to First 3 Months 2018
o 42.3 – all (↓ 14.2%)
o 32.7 – detached (↓ 17.6%)
o 9.7 – row & semi-detached (↔ 0.0%)
Average Months of Inventory
o 1.3 – all (↓ 42.9%)
o 1.3 – detached (↓ 50.0%)
o 0.7 – row & semi-detached (↓ 33.3%)
[1] Excludes condominiums, homes on leased land and homes under construction.
[2] All data courtesy of the Ottawa Real Estate Board MLS® System. The above Information is believed to be accurate but not warranted.