STITTSVILLE HOUSING MARKET UPDATE, Q3 2019
STITTSVILLE HOUSING MARKET UPDATE Q3 2019
Homes sold in Stittsville, Q3 2019

What a ride the Stittsville real estate market is on. Our community continues to be one of the most sought after places to live in Ottawa. It feels like the Spring market right now, especially in the entry-level 375k-450k segment of the market. Can you believe the row-unit market is up over 11% over the same quarter last year?!
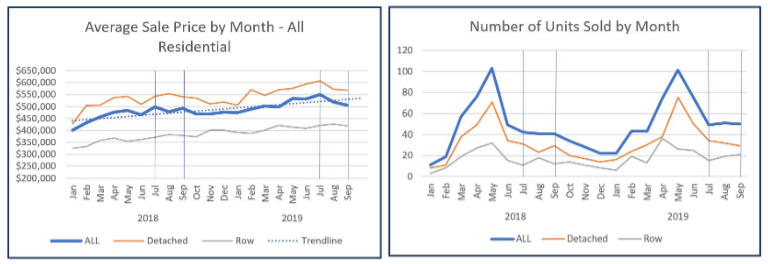
In the third quarter of 2019, a total of 150 homes sold in Stittsville between July 1st and September 30th, up significantly when compared to the same period in 2018, and rather steady at 50 homes a month for the quarter. Buyers right now have less to choose from but judging from the sales they are much less picky than in years past. There are so many people eager to get into the market right now. In my 15 years in real estate, I have not seen a more favourable time to be a seller.
As with other areas of the City of Ottawa, inventory levels continue to be low in Stittsville. This has kept upward pressure on prices. We have less than one months of inventory available right now. This is an all-time low.
HIGHLIGHTS
STITTSVILLE HOUSING MARKET UPDATE Q3 2019
Homes Sold from July to September 2019 Compared to July to September 2018
- 150 – all (↑ 21.0%)
- 95 – detached (↑ 14.5%)
- 55 – row & semi-detached (↑ 34.1%)
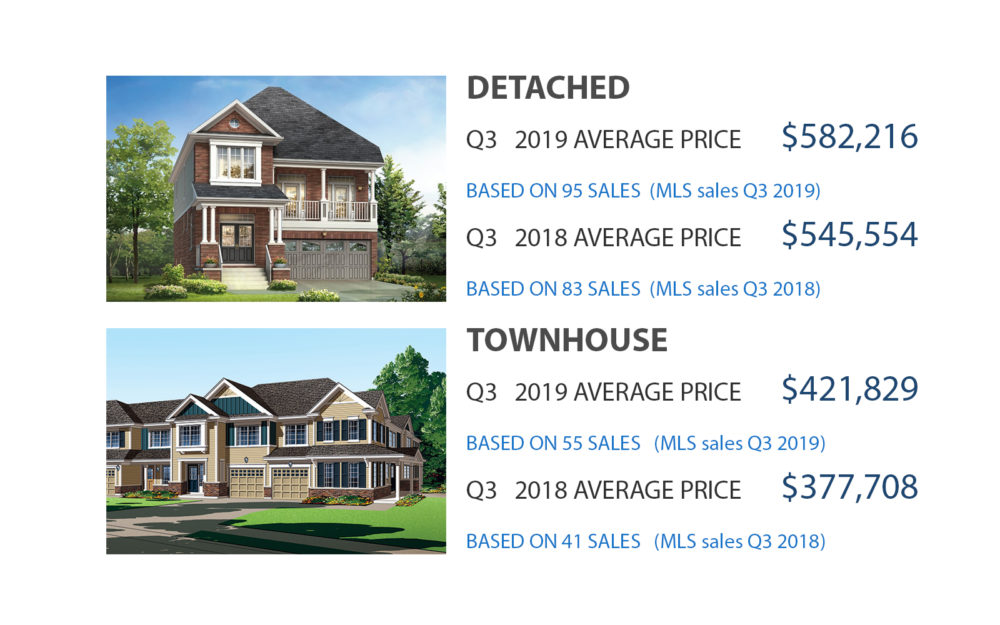
Average Sold Price from July to September 2019 Compared to July to September 2018
- $524,220 – all (↑ 7%)
- $582,216 – detached (↑ 6.7%)
- $421,839 – row & semi-detached (↑ 11.7%)
Average Total Days on Market from July to September 2019 Compared to July to September 2018
- 23 – all (↓ 33.0%)
- 26 – detached (↓ 32.2%)
- 16 – row & semi-detached (↓ 42.9%)
Active Listings from July to September 2019 Compared to July to September 2018
- 47.7 – all (↓ 11.2%)
- 36.3 – detached (↓ 20.4%)
- 11.3 – row & semi-detached (↑ 41.7%)
Average Months of Inventory
- 1 – all (↔ 0.0%)
- 1 – detached (↓ 40.0%)
- 1 – row & semi-detached (↑ 50.0%)
1 ] Excludes condominiums, homes on leased land and homes under construction.
2 ] All data courtesy of the Ottawa Real Estate Board MLS® System. The above information is believed to be accurate but not
warranted.