STITTSVILLE HOUSING MARKET UPDATE, MARCH 2017
March 2017 Stittsville Sales
I am pleased to provide you with the following snapshot of the real estate market for the Stittsville area.
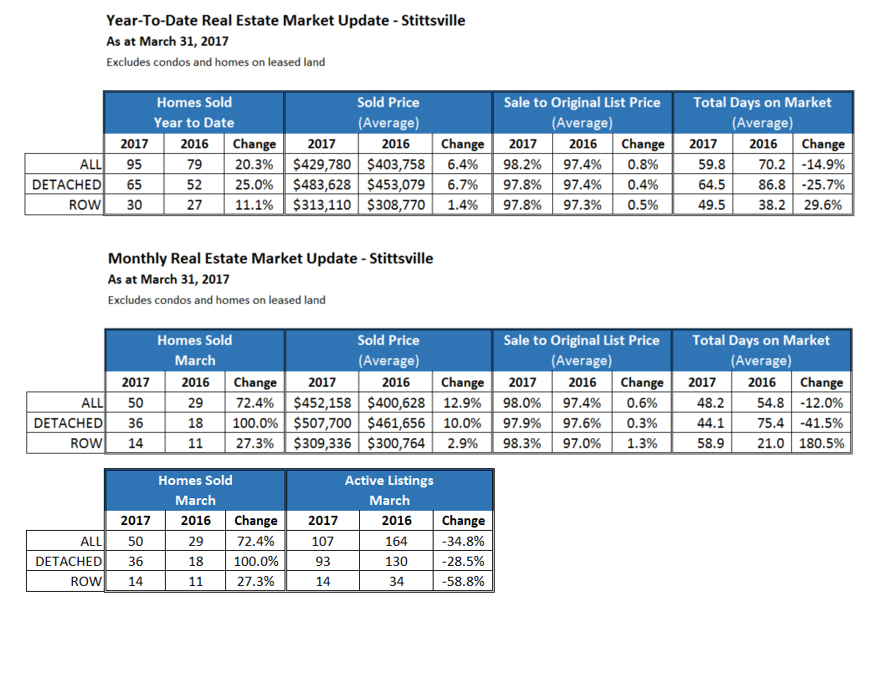
In March, 50 homes were sold in Stittsville compared to 29 homes in March 2016. That is an increase of 72.4% year over year. These sales bring the total number of homes sold since January 1 to 95 compared to 79 homes for the same period in 2016. Good sign of a very healthy market that is slowly starting to favour sellers.
The average sale price of homes sold in Stittsville also increased in March by nearly 13% over March 2016. That is going from $400,628 in 2016 to $452,158 in 2017. Breaking down sales by detached and row styles show that the average sale price of single detached homes sold in March was $507,700, up 10.0% over the same period in 2016. The average sale price for a row style home was up 2.9% to $309,336.
Looking at total days on market, the homes sold in Stittsville in March had been on the market for an average of 48.2 days, 12% fewer days than those sold in March 2016. The average days on market for the detached homes sold was 44.1 days while row homes, including semi-detached, sold in 58.9 days. Last year, these numbers were 75.4 and 21.0 days respectively. This is the third consecutive month where an average number of days on market has decreased over the previous year. Across the Ottawa Real Estate Board, the average total days on market was 82.
Finally, a look at the number of active listings in March shows nearly 35% less inventory offered on the Ottawa Real Estate Board’s MLS® System than in 2016. There were 107 active listings at the end of March 2017 in Stittsville.
Highlights
- Homes Sold Last Month
- 50 – all (↑ 72.4%)
- 36 – detached (↑ 100%)
- 14 – row and semi-detached (↑ 27.3%)
- Average Sold Price
- $452,158 all (↑ 12.9%)
- $507,700 detached only (↑ 10.0%)
- $309,336 row and semi-detached (↑ 2.9%)
- Total Days on Market
- 8 days for detached and row & semi-detached combined (↓ 12.0%)
- 1 days for detached (↓ 41.5%)
- 9 for row and semi-detached (↑ 180.5%)
- Sale to Original List Price
- 0% across the all types compared to 97.4% in 2016 (↑0.6%)
- 9% for detached home sales compared to 97.6% in 2016 (↑ 0.3%)
- 3% for row and semi-detached styles compared to 97.0% in 2016 (↑ 1.3%)
- Active Listings
- 107 active detached and row & semi-detached listings combined (↓ 34.8%)
- 93 active detached listings (↓ 28.5%)
- 14 active for row and semi-detached listings (↓ 58.8%)
[i] Excludes condominiums and homes on leased land.
[ii] All data courtesy of the Ottawa Real Estate Board MLS® System.