STITTSVILLE HOUSING MARKET UPDATE, FEBRUARY 2017
I am pleased to provide you with the following snapshot of the real estate market for the Stittsville area.
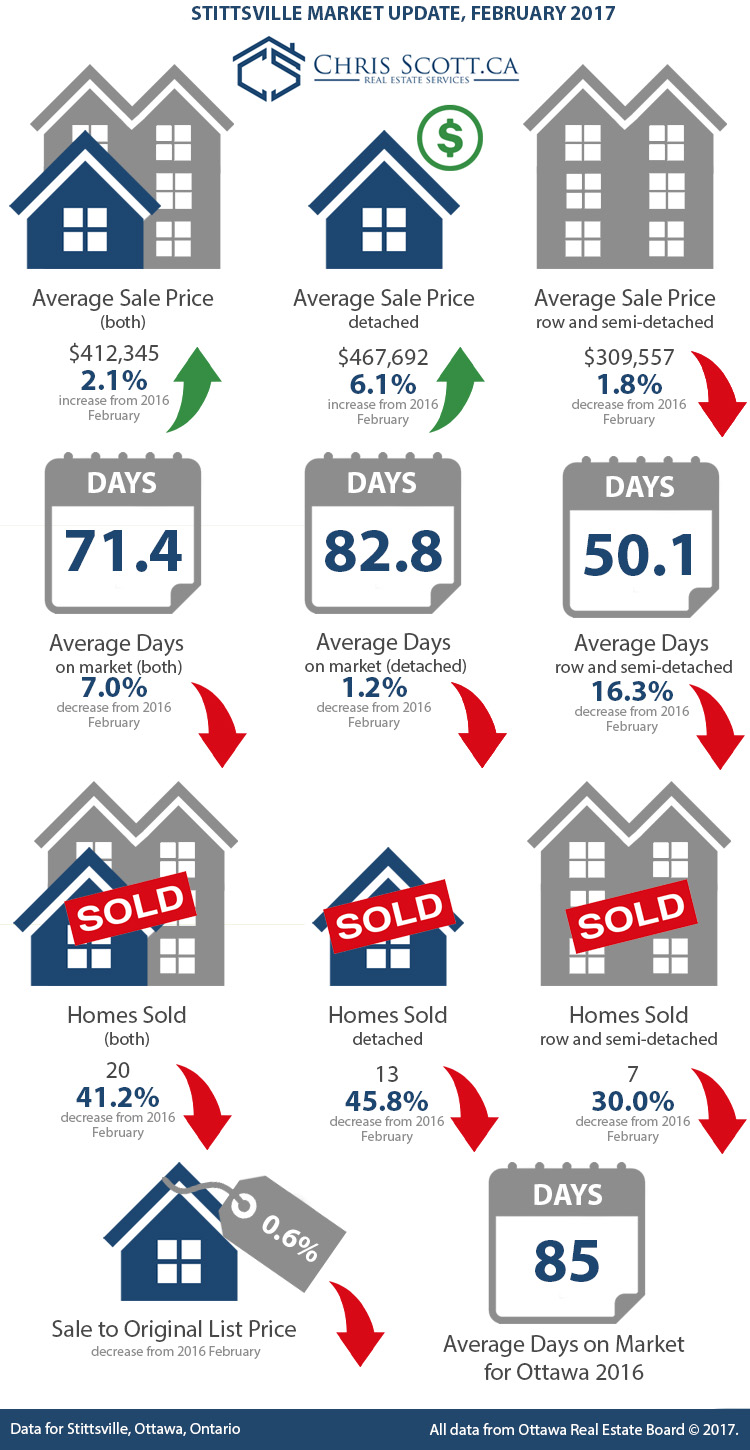
In February, 20 homes were sold in Stittsville compared to 34 homes in February 2016. That is a decline of 41.2%. A look at home sales since between January 1 and February 28, 45 homes were sold in Stittsville in 2017 compared to 50 homes in 2016, a year-to-date drop of 10%.
The average sale price of homes sold in Stittsville increased in February by 2.1% over February 2016 from $403,851 last year to $412,345 in 2017. Breaking down sales by detached and row styles show that the average sale price of single detached homes sold in February was $467,692, up 6.1% over the same period in 2016. The average sale price for a row style home was down 1.8% to $309,557.
Looking at total days on market, the homes sold in Stittsville in February had been on the market for an average of 71.4 days, 7% fewer days than those sold in February 2016. The average days on market for the detached homes sold was 82.8 days while row homes, including semi-detached, sold in 50.1 days. Last year, these numbers were 83.8 and 59.9 days respectively. This is the second month where an average number of days on market has decreased over the previous year.
And how do sale prices stack up against listing price? In Stittsville, this figure is down slightly to 96.9%.
Finally, a look at the number of active listings in February shows lower inventory than in 2016 by 17% overall. There were 93 active listings at the end of February.
Highlights
Homes Sold
o 20 – all (↓ 41.2%)
o 13 – detached (↓ 45.8%)
o 7 – row and semi-detached (↓ 30.0%)
Sold Price
o $412,345 all (↑ 2.1%)
o $467,692 detached only (↑ 6.1%)
o $309,557 row and semi-detached (↓ 1.8%)
Total Days on Market
o 71.4 days for detached and row & semi-detached combined (↓ 7.0%)
o 82.8 days for detached (↓ 1.2%)
o 50.1 for row and semi-detached (↓ 16.3%)
Sale to Original List Price
o 96.9% across the all types compared to 97.5% in 2016 (↓ 0.6%)
o 96.8% for detached home sales compared to 97.5% in 2016 (↓ 0.7%)
o 97.3% for row and semi-detached styles compared to 97.7% in 2016 (↓ 0.4%)
Active Listings
o 93 active detached and row & semi-detached listings combined (↓ 17.0%)
o 77 active detached listings (↓ 9.4%)
o 16 active for row and semi-detached listings (↓ 40.7%)