From the blog...
QUALICUM’S ANNUAL MARKET REPORT 2016
I am pleased to provide you with my year-end review of the real estate market for the Qualicum area.
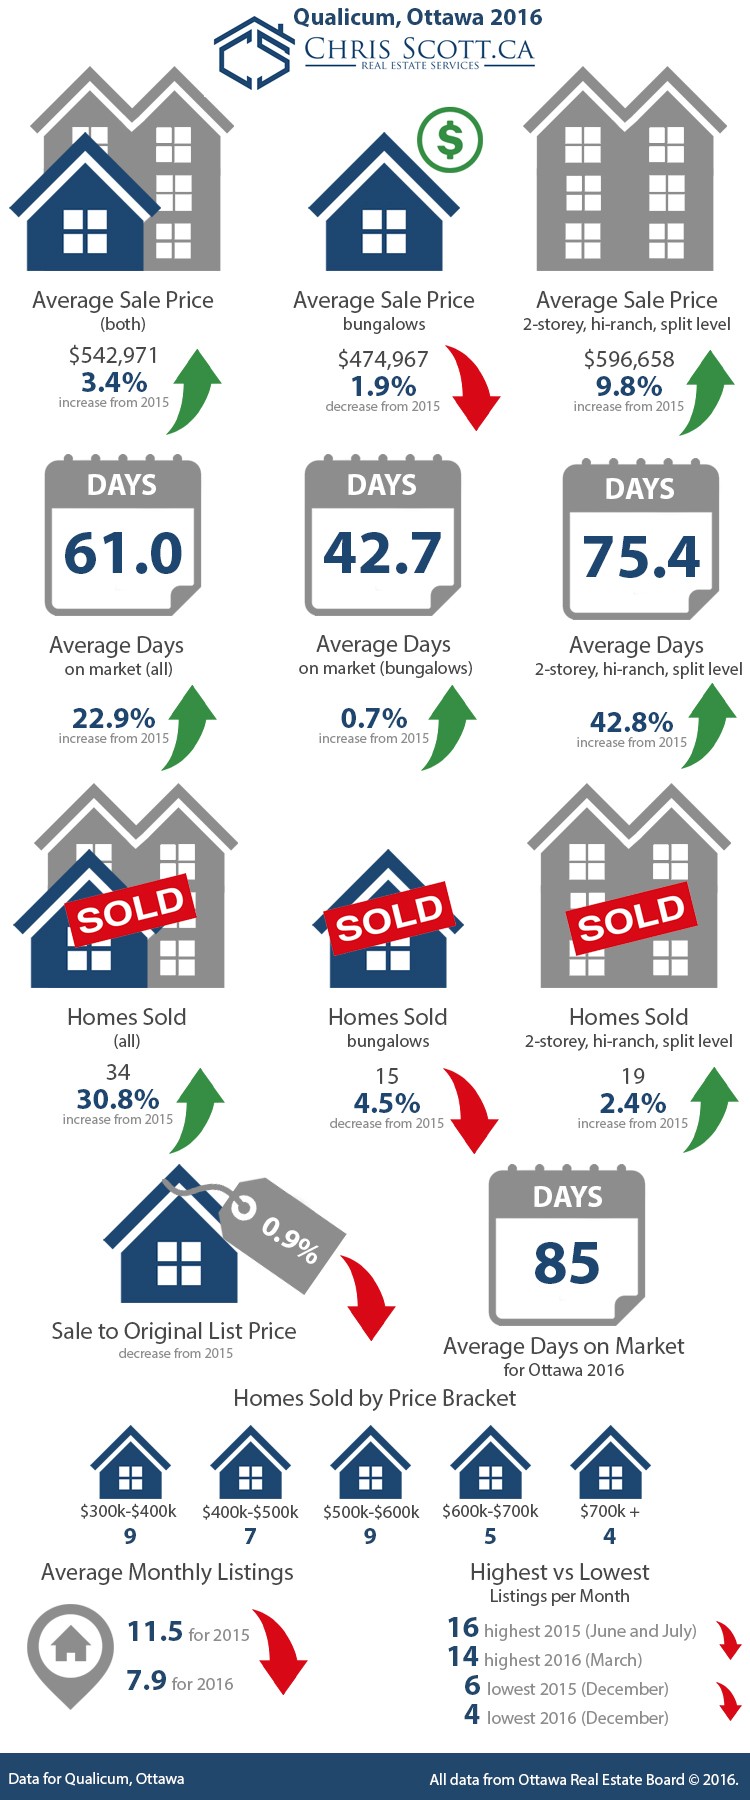
The average sale price of a home sold in Qualicum rose by 3.4% to $542,971. When we look more closely, we can see that it is the 2-storey, hi-ranch, and split level category that supported this rise, as these homes sold on average for $596,658 which is about a 9.8% increase over the last year. Bungalow prices slightly dropped to $474,967 or 1.9% decrease.
Where the biggest real estate change can be observed is in the total days on market. In Qualicum, much like the rest of Ottawa, total days on the market continues to increase. Year-to-date, the average time to sell a home in Qualicum is 61.0 days. For bungalows, it has taken 42.7 days to sell this style of homes which is only a 0.7% increase over 2015. Yet for the 2-storey, hi-ranch, and split level category, it took 75.4 days, on average. The is a large 42.8% increase from 2015.
And how do sale prices stack up against listing prices? In Qualicum, this figure is a 0.9% slight decrease over last year.
The average monthly listing dropped from 11.5 in to 2015 to 7.9 in 2016. The highest vs lowest listing months also dropped. One thing to note is the highest listing month in 2015 was June but in 2016 it was March. Both for 2015 and 2016 December was the lowest active listing month.
If you would like to know your home’s value, please fill out our Home Evaluation Form here: SELLERS HOME EVALUATION
[1] All data from Ottawa Real Estate Board © 2016.


