This month, Chris shares insights on the Ottawa real estate market, noting stable sales numbers compared to last year, an increase in new listings, and varied pricing strategies among sellers. Some homes are selling quickly in competitive situations, while others face price reductions. Check out our latest market update for more!
Thinking about adding a secondary unit to your existing home? Secondary dwellings, also known as in-law suites or accessory apartments, can offer various benefits such as additional income and increased property value. Here’s a concise guide on what you need to know before embarking on this home improvement journey in Ottawa.
Understanding the Basics
What is a Secondary Dwelling? A secondary dwelling is a self-contained unit with its own kitchen, bathroom, and sleeping area. It can be part of your existing house or a separate structure on your property.
Key Considerations:
Zoning Requirements: Check if your area allows secondary units using the geoOttawa tool.
Building Permits: Essential for ensuring safety and compliance with regulations.
Building Code Compliance: Ensure your construction meets the minimum standards.
Inspections: The City of Ottawa will inspect your unit during construction.
Ottawa-Specific Rules
Size and Access:
A secondary unit can occupy up to 40% of your principal dwelling’s floor area. There’s no size limit for basement units.
The unit must have a separate ground floor entrance and should not add a new doorway on the front wall of your home.
Parking and Location:
The secondary unit cannot eliminate the required parking for the main dwelling.
Additional parking is not mandatory, but if added, it cannot be in the front yard.
Dwelling Types Permitted:
Detached dwellings, linked-detached dwellings, semi-detached dwellings, townhouses, and duplexes (existing as of July 17, 2013).
Financial Benefits and Costs
Adding a secondary dwelling can affect your property taxes and insurance. Here are some costs you might incur:
Remodeling Costs: Ranges from $30,000 to $100,000, covering elements like firewalls, egress, heating systems, bathrooms, kitchens, and electrical upgrades.
Permit Fees: Minimum of $100.
Financial Assistance:
Better Homes Ottawa Loan Program: Offers fixed-rate, low-interest loans for home energy improvements, covering up to 30% of the cost for secondary suites.
Rental Income and Payback
Using the median rental prices from the Ottawa Neighborhood Study, the payback period for your investment can be calculated. For example, with an average cost of $100,000 and a monthly rent of $1,503, the payback period is approximately 5.54 years.
Enhancing Energy Efficiency
When adding a secondary suite, consider improving your home’s energy efficiency:
Building Envelope: Upgrade walls, windows, doors, roof, foundation, and insulation.
Heating and Cooling: Install efficient systems like cold climate heat pumps.
Renewables: Add solar panels, geothermal systems, and battery backups.
Smart Technology: Use smart thermostats and LED lights.
Resilience Measures: Implement stormwater management and install cool or green roofs.
Adding a secondary dwelling is a substantial investment that can yield significant returns through rental income and increased property value. Ensuring compliance with Ottawa’s specific regulations and enhancing your home’s energy efficiency will maximize the benefits of this project.
For more detailed information, visit the City of Ottawa’s website and the Better Homes Ottawa program
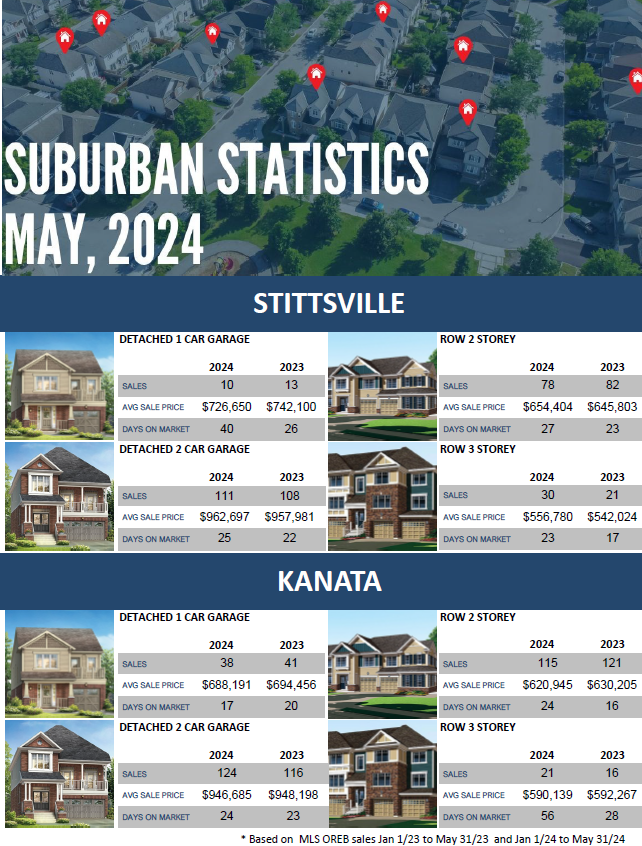
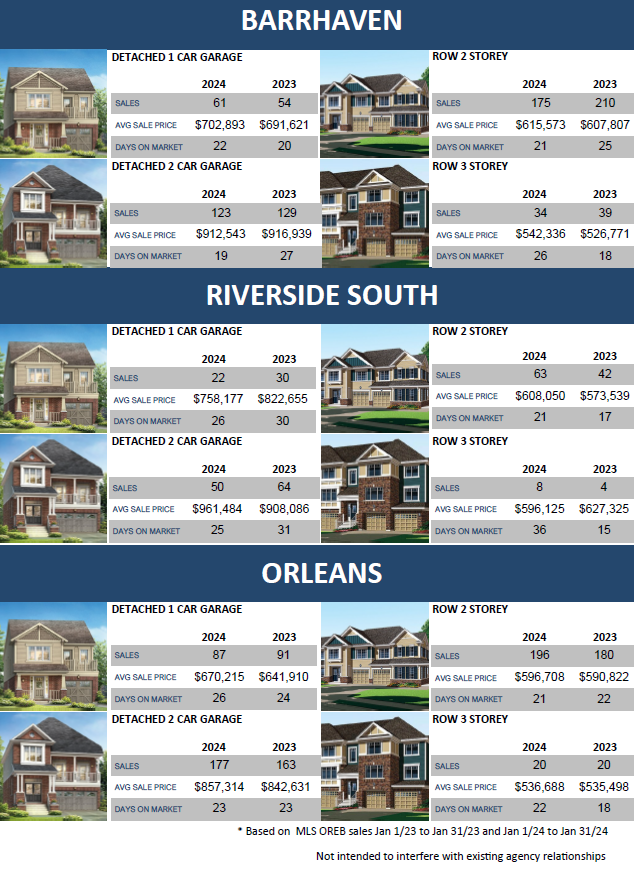
Here’s the newest Suburban Statistics Series update. We’re highlighting stats for the five biggest urban neighbourhoods in Ottawa. Since Ottawa is pretty spread out, it’s interesting to see how things vary in each area. These stats are all based on MLS OREB sales from January 1, 2023, to May 31, 2023, compared to the same period from January 1, 2024, to May 31, 2024.
In this month’s update, Chris shares intriguing conversations with buyers, sellers, and agents, offering diverse perspectives on the current market. Whether you’re a mid-range buyer or a luxury seller, we discuss how the market trends are impacting you. Stay informed and gain valuable insights by watching our May market update video.
Welcome to our latest market update with Chris Scott! As we navigate the vibrant month of May, traditionally the peak of the real estate season, we’re seeing a mix of eager buyers and strategic sellers shaping the market. This video offers a deep dive into the current dynamics of Ottawa’s real estate scene, where buyers are cautiously hunting for deals and testing the waters with their offers. From fluctuating interest rates to new government mandates affecting workplace locations, Chris discusses the potential impacts on property demands and market momentum. Whether you’re considering selling your home or curious about purchasing near your workplace, stay tuned as we explore these intriguing trends.
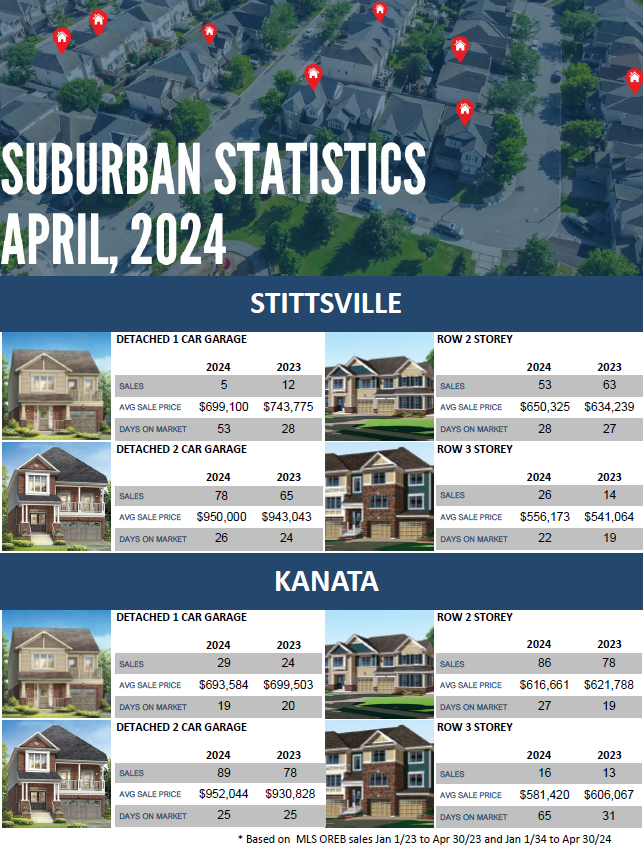
Here’s the newest Suburban Statistics Series update. We’re highlighting stats for the five biggest urban neighbourhoods in Ottawa. Since Ottawa is pretty spread out, it’s interesting to see how things vary in each area. These stats are all based on MLS OREB sales from January 1, 2023, to April 30, 2023, compared to the same period from January 1, 2024, to April 30, 2024.
While the market remains balanced, homes are taking longer to sell—often 30 to 60 days—unless they’re well-priced and in good condition. Sellers holding out for last year’s prices are finding they need to make significant price reductions.
Also, an important update on capital gains tax: properties over $250,000 will soon see a tax increase to 66%. This change, effective June 25th, affects many, particularly investors relying on real estate as part of their retirement planning. This policy could prompt investors to sell before the tax hike impacts their returns.
Dive deeper with Chris’s predictions below. And, as always, if you’re curious about the latest trends in your neighbourhood, our team would love to provide a personalized assessment of what your home could fetch in today’s market
In Ontario’s real estate market, staying one step ahead is crucial, especially with recent legislative changes making exclusive listings—homes not advertised on the public market—more private than ever. But accessing these hidden gems just got easier for our clients, thanks to our partnership with Knokd.
Exclusive listings offer a unique advantage: they benefit sellers seeking privacy and buyers eager for less competition and early access to unique properties. With Ontario’s new legislation tightening rules around advertising these properties, they’ve become even more elusive. That’s where Knokd comes in.
Knokd is our secret weapon. This program allows us to share with you listings that are coming soon or are exclusively available, ensuring you’re first in line for properties that perfectly match your criteria—properties you won’t find on MLS or online platforms.
With our expertise and exclusive access through Knokd, we’re not just finding you a home; we’re uncovering opportunities that others don’t even know exist. Ready to step ahead in Ontario’s competitive real estate market? Get in contact today!
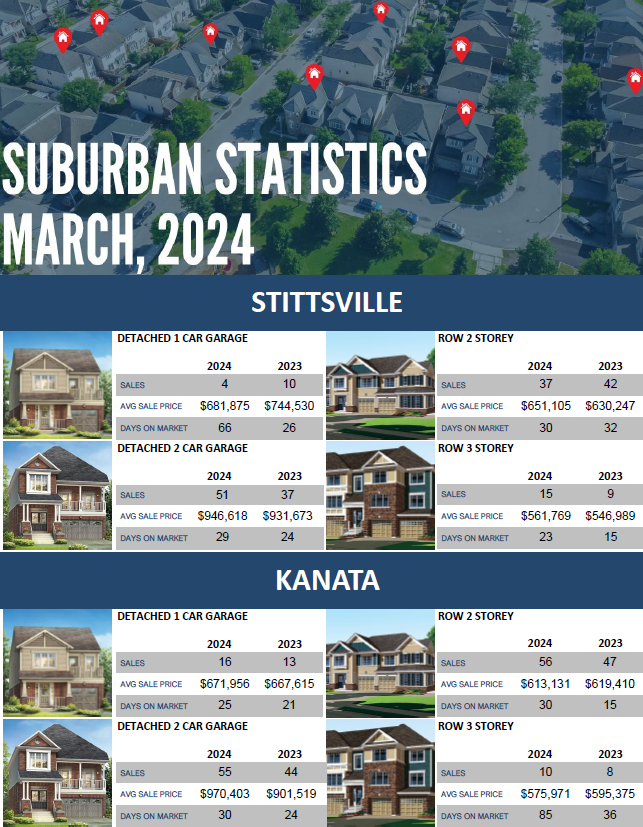
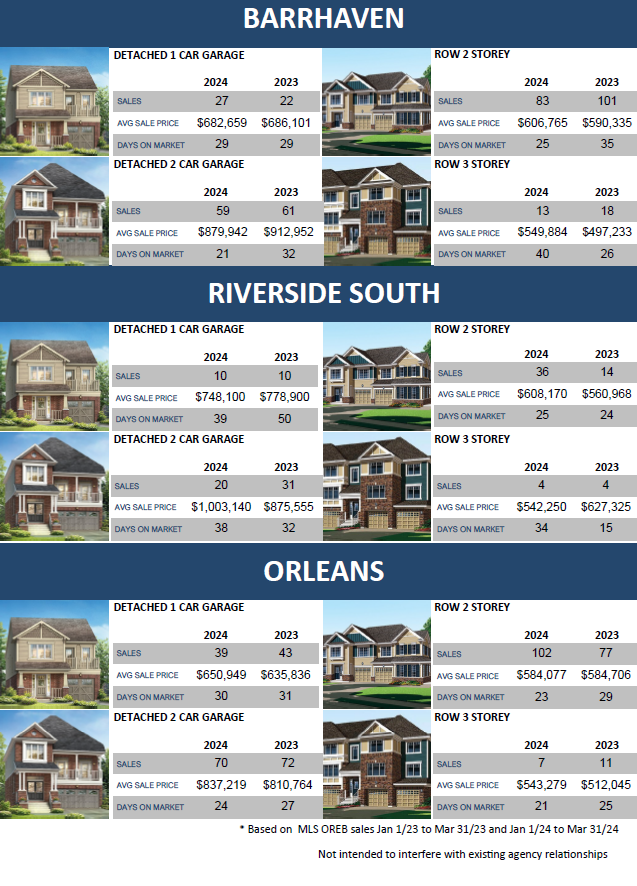
Here’s the newest Suburban Statistics Series update. We’re highlighting stats for the five biggest urban neighbourhoods in Ottawa. Since Ottawa is pretty spread out, it’s interesting to see how things vary in each area. These stats are all based on MLS OREB sales from January 1, 2023, to March 31, 2023, compared to the same period from January 1, 2024, to March 31, 2024.
As the temperatures rise, so does the activity in the Ottawa real estate market. Buyers are emerging again, actively making offers on properties that are well priced and present well. While some sellers are hanging on to 2022 inflated prices they tend to remain sitting on the market.
The Bank of Canada’s target inflation rate stands between 1-3%, with our current standing at 2.9%. Although we’re within the target range, we’re not at the lower end, which is why we did not see an interest rate adjustment this past week. If we get that closer to 2% we might see some rate relief by June. Despite this, buyers are already factoring in possible changes and maintaining consumer confidence amidst a market of low inventory. This begs the question: will we maintain a balanced market, lean toward a seller’s market again, or shift to a buyer’s market.
Dive deeper with Chris’s predictions below. And, as always, if you’re curious about the latest trends in your neighbourhood, our team would love to provide a personalized assessment of what your home could fetch in today’s market