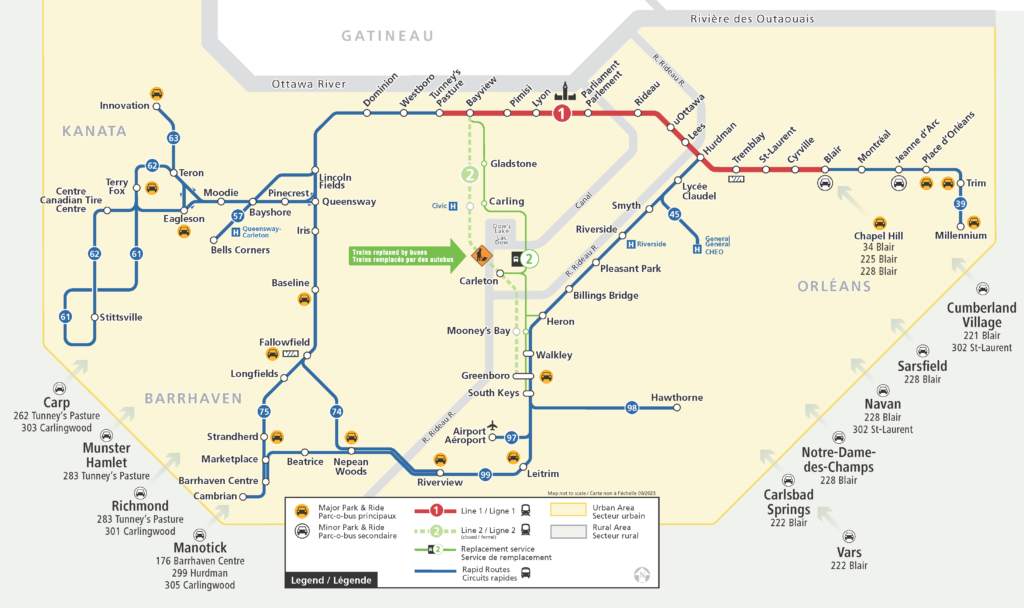
Relocating to Ottawa for a military assignment comes with its own set of challenges, one of which is finding convenient and efficient ways to commute to key locations such as the DND Headquarters on Carling Avenue and downtown Ottawa. For those who prefer to avoid the hassle of downtown parking and traffic, Ottawa offers several Park and Ride options that make the daily commute smoother and more efficient. Here’s a look at some of the best Park and Ride options and the transit times to major destinations using OC Transpo services.
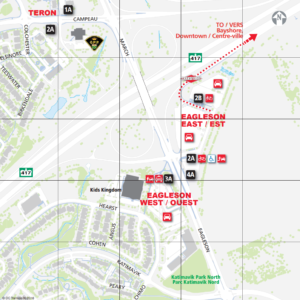
Eagleson Park & Ride
To DND Headquarters:
Transit Time: Approximately 30-35 minutes.
Route: Take Route 63 or 64 directly to Tunney’s Pasture, then transfer to Route 66 or another bus heading towards Carling Avenue.
Details: Eagleson Park & Ride, located at Highway 417 and Eagleson Road, offers easy access to Connexion routes and has ample parking space.
To Downtown Ottawa (National Defence Headquarters):
Transit Time: Approximately 25-30 minutes.
Route: Take Route 63 or 64 directly to downtown.
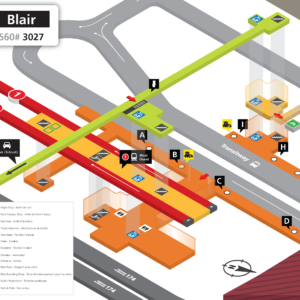
Blair Park & Ride
To DND Headquarters:
Transit Time: Approximately 55-60 minutes.
Route: Take the O-Train Line 1 to Tunney’s Pasture, then transfer to Route 66 or another bus heading towards Carling Avenue.
Details: Situated in the east end, Blair Station is a key transit hub.
To Downtown Ottawa (National Defence Headquarters):
Transit Time: Approximately 20-25 minutes.
Route: Take the O-Train Line 1 directly to downtown.
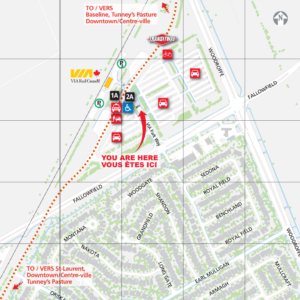
Fallowfield Park & Ride
To DND Headquarters:
Transit Time: Approximately 40-45 minutes.
Route: Take Route 95 or 74 to Tunney’s Pasture, then transfer to Route 66 or another bus heading towards Carling Avenue.
Details: Located at 100 Via Park Place, Fallowfield Park & Ride offers free parking and is well-connected with Fallowfield Station for transit options.
To Downtown Ottawa (National Defence Headquarters):
Transit Time: Approximately 35-40 minutes.
Route: Take Route 95 or 74 directly to downtown.
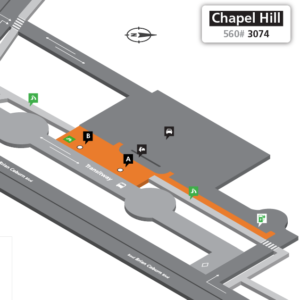
Chapel Hill Park & Ride
To DND Headquarters:
Transit Time: Approximately 70-75 minutes.
Route: Take Route 32 or 33 to Blair Station, then transfer to the O-Train Line 1 to Tunney’s Pasture, followed by Route 66.
Details: Located at Brian Coburn Blvd and Navan Rd, it offers free parking and good transit connections.
To Downtown Ottawa (National Defence Headquarters):
Transit Time: Approximately 35-40 minutes.
Route: Take Route 32 or 33 to Blair Station, then transfer to the O-Train Line 1 to downtown.
Trim Park & Ride
To DND Headquarters:
Transit Time: Approximately 80-85 minutes.
Route: Take Route 39 to Blair Station, then transfer to the O-Train Line 1 to Tunney’s Pasture, followed by Route 66.
Details: This location is in the eastern outskirts, with direct transit routes available.
To Downtown Ottawa (National Defence Headquarters):
Transit Time: Approximately 45-50 minutes.
Route: Take Route 39 to Blair Station, then transfer to the O-Train Line 1 to downtown.
Making Your Commute Easier
Using Ottawa’s Park and Ride facilities can significantly reduce the stress and cost associated with daily commutes. The OC Transpo Travel Planner is an excellent tool for planning your route and ensuring you catch the next bus or train on time. By leveraging these Park and Ride options, military personnel can enjoy a more convenient and efficient commute, allowing them to focus on their important work at the DND Headquarters or downtown offices.
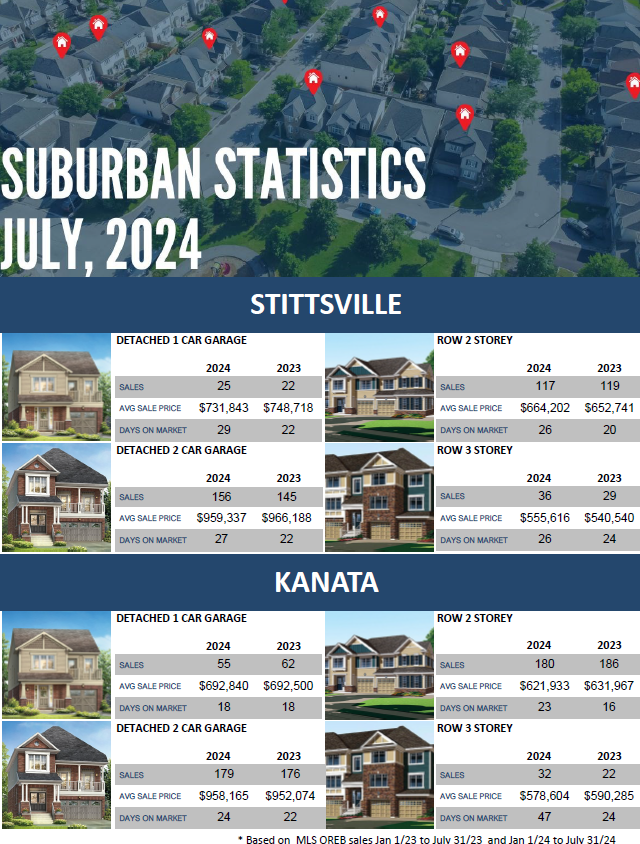
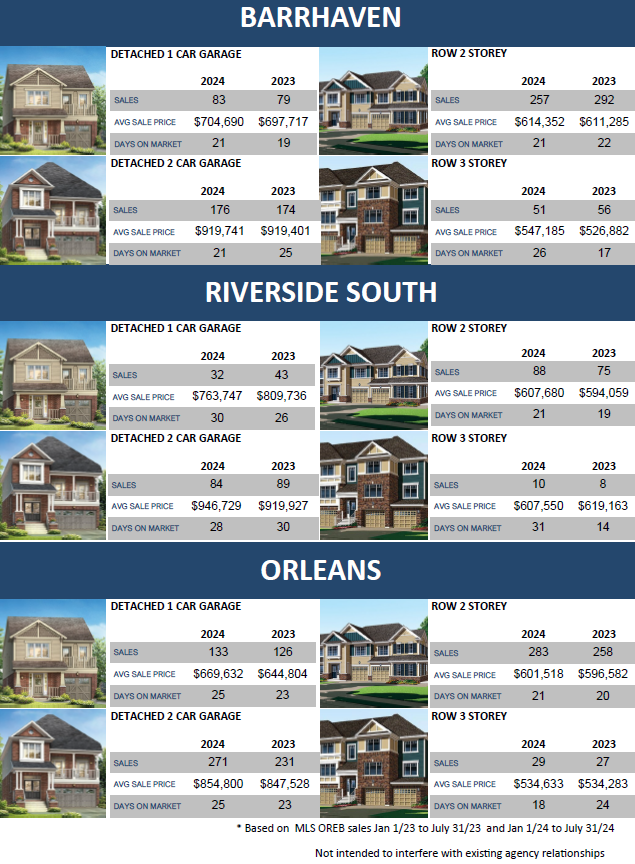
Here’s the newest Suburban Statistics Series update. We’re highlighting stats for the five biggest urban neighbourhoods in Ottawa. Since Ottawa is pretty spread out, it’s interesting to see how things vary in each area. These stats are all based on MLS OREB sales from January 1, 2023, to July 31, 2023, compared to the same period from January 1, 2024, to July 31, 2024.
Join Colin for a quick update on the latest happenings in Ottawa and beyond. With national unemployment rates and recent changes in the Bank of Canada’s lending rate, the real estate market is experiencing some interesting shifts. Buyers are finding more options, while sellers need to focus on making their properties stand out. For more detailed insights and advice, check out our latest update.
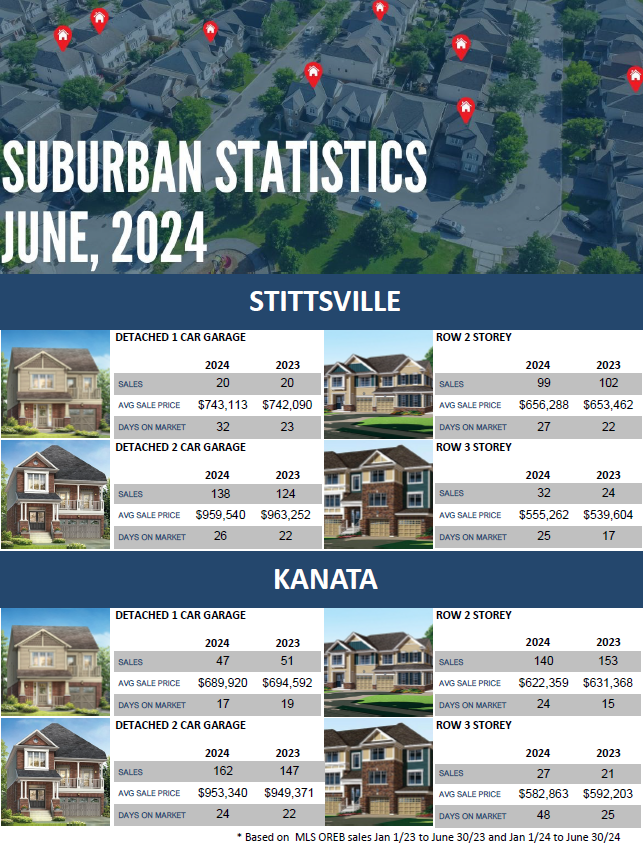
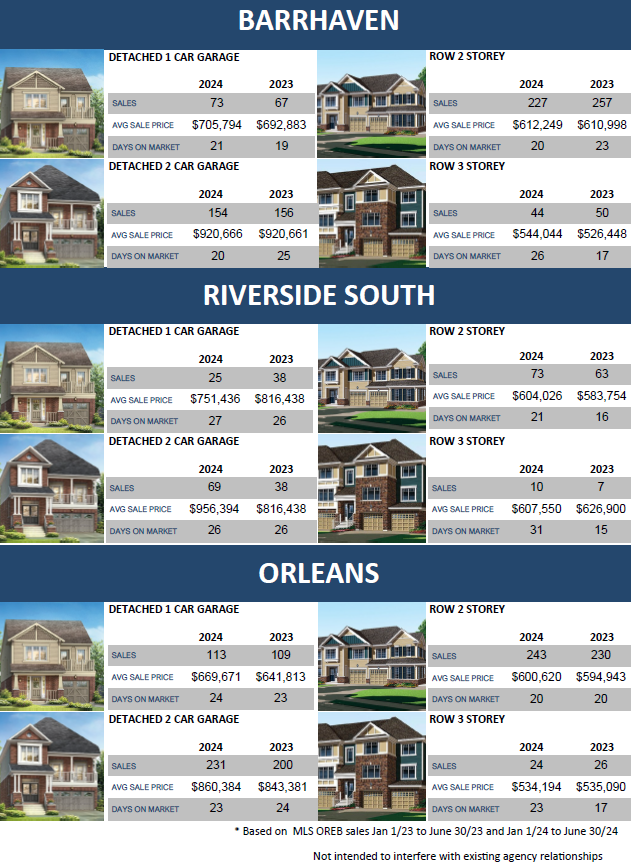
Here’s the newest Suburban Statistics Series update. We’re highlighting stats for the five biggest urban neighbourhoods in Ottawa. Since Ottawa is pretty spread out, it’s interesting to see how things vary in each area. These stats are all based on MLS OREB sales from January 1, 2023, to June 30, 2023, compared to the same period from January 1, 2024, to June 30, 2024.
Join Colin for our latest market update as he reviews the first half of the year and looks ahead to what’s coming. Thanks for your continued support, and enjoy your summer!
This month, Chris shares insights on the Ottawa real estate market, noting stable sales numbers compared to last year, an increase in new listings, and varied pricing strategies among sellers. Some homes are selling quickly in competitive situations, while others face price reductions. Check out our latest market update for more!
Thinking about adding a secondary unit to your existing home? Secondary dwellings, also known as in-law suites or accessory apartments, can offer various benefits such as additional income and increased property value. Here’s a concise guide on what you need to know before embarking on this home improvement journey in Ottawa.
Understanding the Basics
What is a Secondary Dwelling? A secondary dwelling is a self-contained unit with its own kitchen, bathroom, and sleeping area. It can be part of your existing house or a separate structure on your property.
Key Considerations:
Zoning Requirements: Check if your area allows secondary units using the geoOttawa tool.
Building Permits: Essential for ensuring safety and compliance with regulations.
Building Code Compliance: Ensure your construction meets the minimum standards.
Inspections: The City of Ottawa will inspect your unit during construction.
Ottawa-Specific Rules
Size and Access:
A secondary unit can occupy up to 40% of your principal dwelling’s floor area. There’s no size limit for basement units.
The unit must have a separate ground floor entrance and should not add a new doorway on the front wall of your home.
Parking and Location:
The secondary unit cannot eliminate the required parking for the main dwelling.
Additional parking is not mandatory, but if added, it cannot be in the front yard.
Dwelling Types Permitted:
Detached dwellings, linked-detached dwellings, semi-detached dwellings, townhouses, and duplexes (existing as of July 17, 2013).
Financial Benefits and Costs
Adding a secondary dwelling can affect your property taxes and insurance. Here are some costs you might incur:
Remodeling Costs: Ranges from $30,000 to $100,000, covering elements like firewalls, egress, heating systems, bathrooms, kitchens, and electrical upgrades.
Permit Fees: Minimum of $100.
Financial Assistance:
Better Homes Ottawa Loan Program: Offers fixed-rate, low-interest loans for home energy improvements, covering up to 30% of the cost for secondary suites.
Rental Income and Payback
Using the median rental prices from the Ottawa Neighborhood Study, the payback period for your investment can be calculated. For example, with an average cost of $100,000 and a monthly rent of $1,503, the payback period is approximately 5.54 years.
Enhancing Energy Efficiency
When adding a secondary suite, consider improving your home’s energy efficiency:
Building Envelope: Upgrade walls, windows, doors, roof, foundation, and insulation.
Heating and Cooling: Install efficient systems like cold climate heat pumps.
Renewables: Add solar panels, geothermal systems, and battery backups.
Smart Technology: Use smart thermostats and LED lights.
Resilience Measures: Implement stormwater management and install cool or green roofs.
Adding a secondary dwelling is a substantial investment that can yield significant returns through rental income and increased property value. Ensuring compliance with Ottawa’s specific regulations and enhancing your home’s energy efficiency will maximize the benefits of this project.
For more detailed information, visit the City of Ottawa’s website and the Better Homes Ottawa program
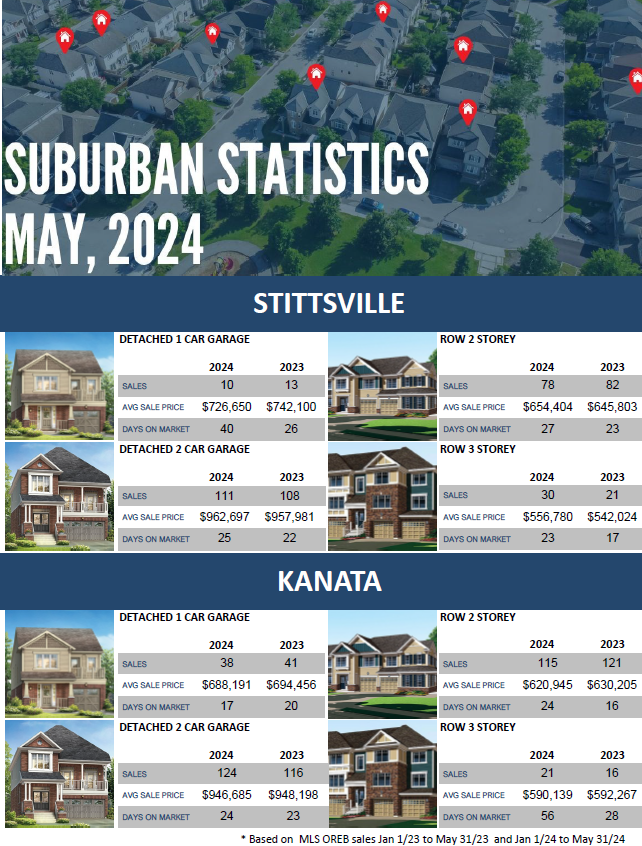
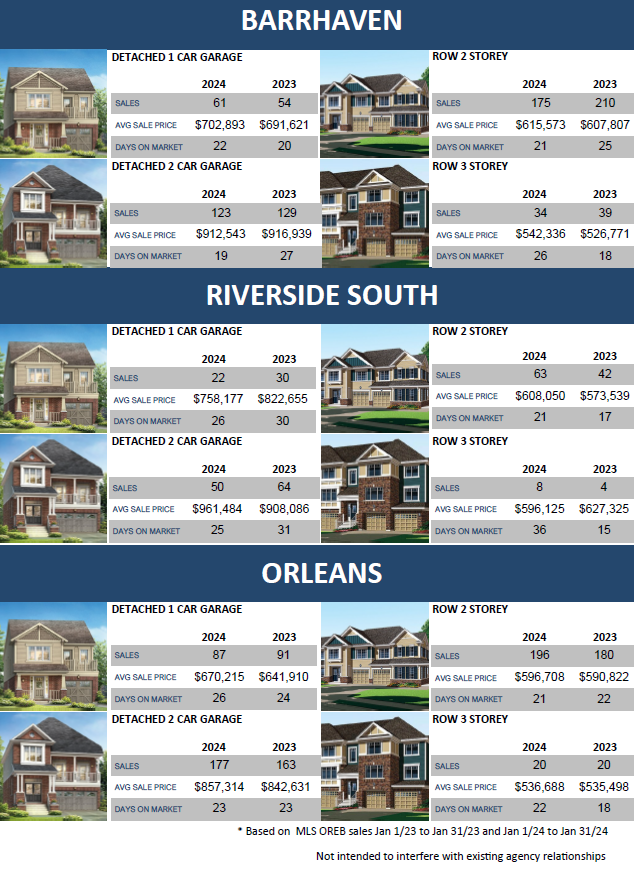
Here’s the newest Suburban Statistics Series update. We’re highlighting stats for the five biggest urban neighbourhoods in Ottawa. Since Ottawa is pretty spread out, it’s interesting to see how things vary in each area. These stats are all based on MLS OREB sales from January 1, 2023, to May 31, 2023, compared to the same period from January 1, 2024, to May 31, 2024.
In this month’s update, Chris shares intriguing conversations with buyers, sellers, and agents, offering diverse perspectives on the current market. Whether you’re a mid-range buyer or a luxury seller, we discuss how the market trends are impacting you. Stay informed and gain valuable insights by watching our May market update video.
We recently had the pleasure of assisting a military couple with their house hunt in Ottawa, turning it into an efficient and exciting adventure. The journey began with setting up a personalized portal tailored to their preferences,
allowing them to interact with listings by favouriting, disliking, and commenting on homes. This interactive approach helped Chris develop a strategic itinerary to maximize their limited viewing time.
To ensure efficiency during their brief visit, Chris pre-booked an inspection with a trusted home inspector before the couple’s arrival. This foresight was crucial in accommodating the tight timeframe and guaranteed that they could work with a reliable inspector.
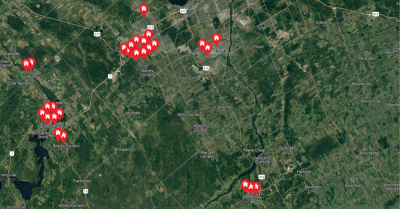
Upon their arrival on a Sunday, the couple dived into their home search, visiting 28 homes over four days across Ottawa and its surrounding areas. Chris’s deep knowledge of the region helped them explore a variety of neighbourhoods, from the small-town feel of Carleton Place & Kemptville to the notable suburbs of Kanata, Barrhaven and Stittsville. We explored them all! More inventory in the 2024 posting season has made military house hunting in Ottawa easier than in previous years. Good to see more balanced conditions in our marketplace.
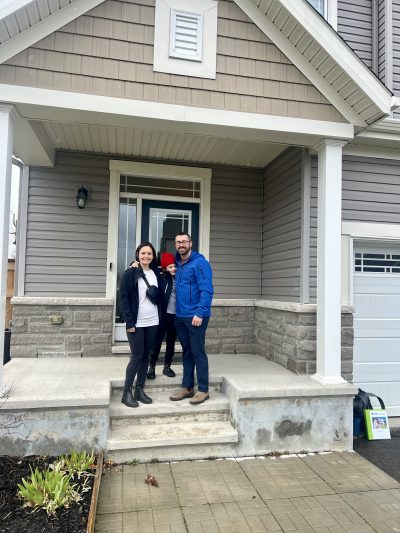
The highlight of their trip was of course finding their dream home in Kemptville and swiftly fulfilling the home inspection condition, providing them with essential peace of mind.
This story exemplifies the success of a well-planned House Hunting Trip (HHT). If you’re preparing for your HHT in Ottawa or surrounding areas, our team is ready to guide you through every step, ensuring a smooth and successful home-buying experience.
Interested in starting your house-hunting journey? Contact us today to learn how we can assist you!