OTTAWA MARKET UPDATE: OCTOBER 2023
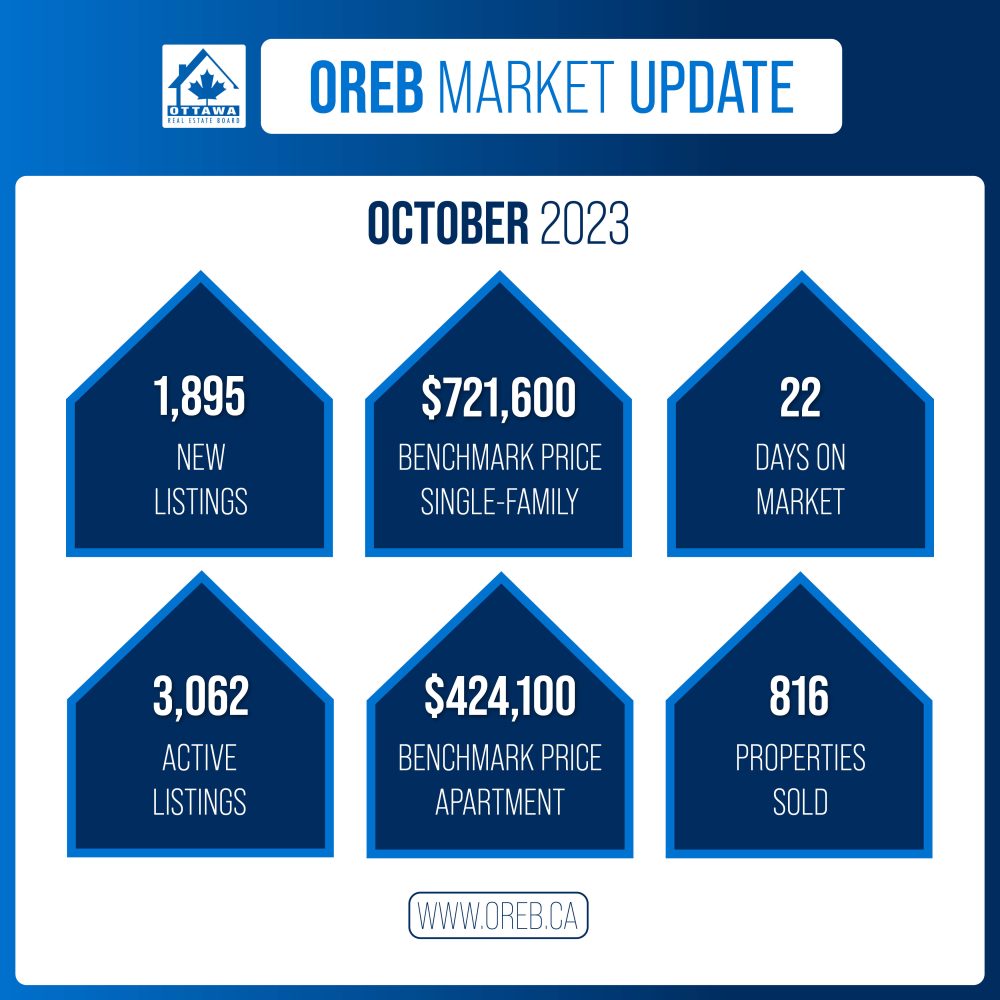

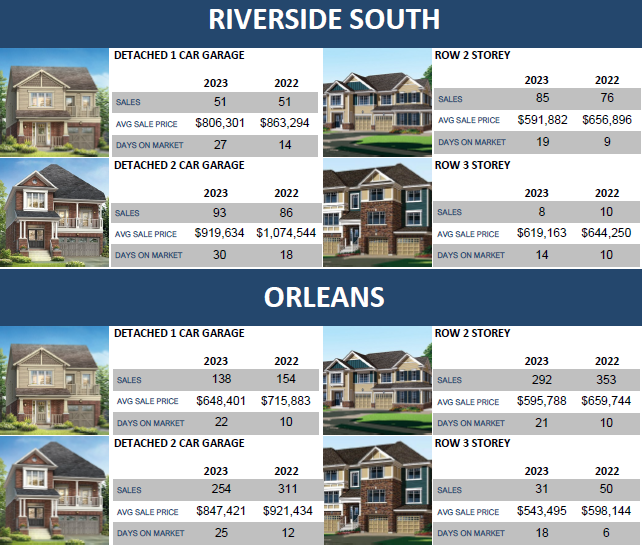
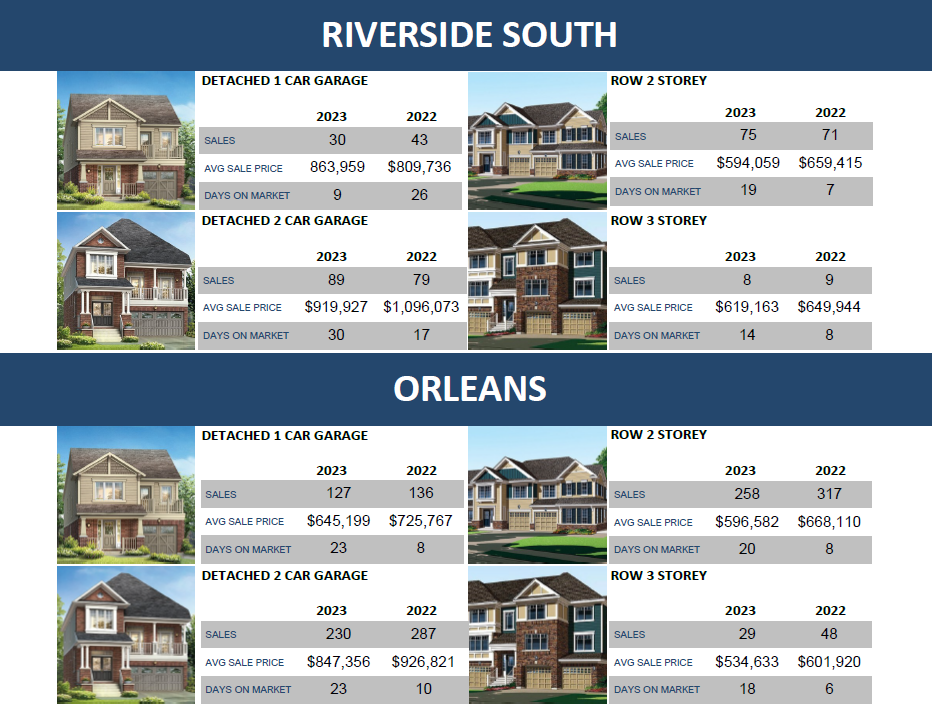
Here is the most recent installment of our new monthly value-added feature, the Suburban Statistics Series. This series showcases statistics for the 5 largest urban neighbourhoods in Ottawa.
As Ottawa is such a spread-out city it’s great to see the variances from area to area. All of these statistics are based on MLS OREB sales from January 1, 2022, t0 October 31, 2022, over January 1, 2023, to October 31, 2023
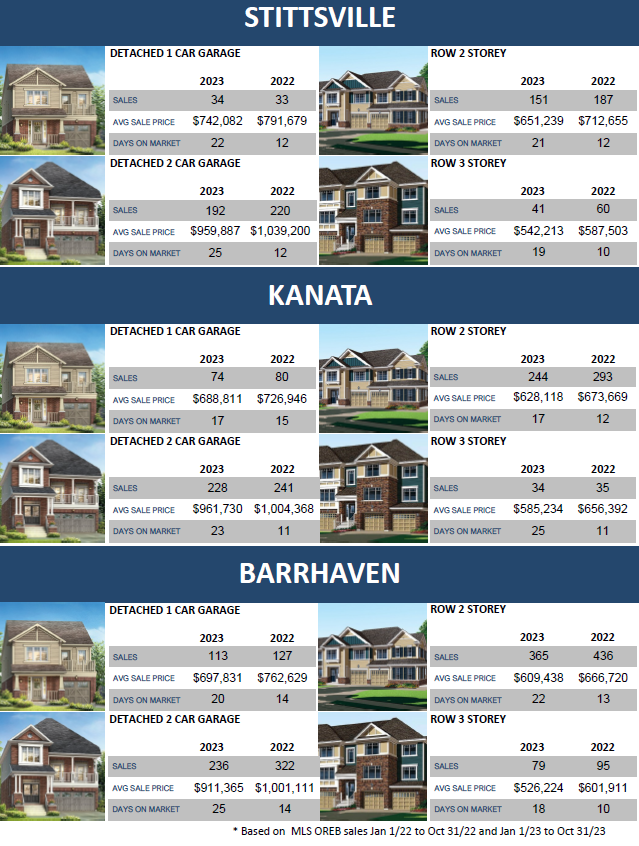
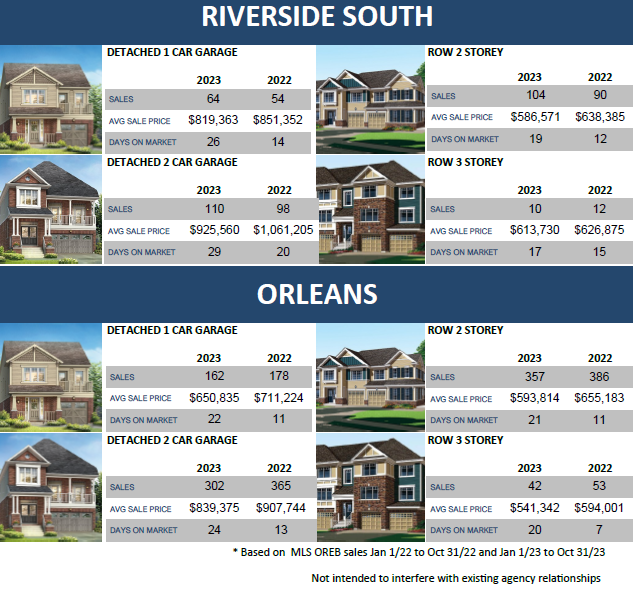
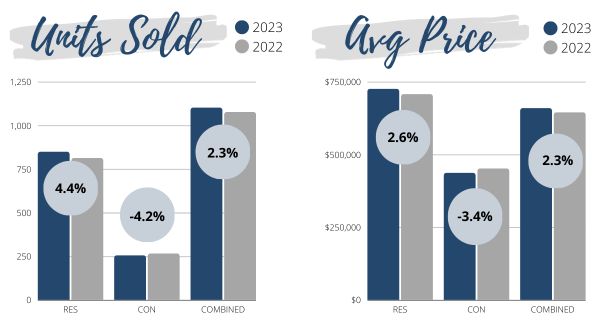

Here is the most recent installment of our new monthly value-added feature, the Suburban Statistics Series. This series showcases statistics for the 5 largest urban neighbourhoods in Ottawa.
As Ottawa is such a spread-out city it’s great to see the variances from area to area. All of these statistics are based on MLS OREB sales from January 1, 2022, t0 September 30, 2022, over January 1, 2023, to September 30, 2023
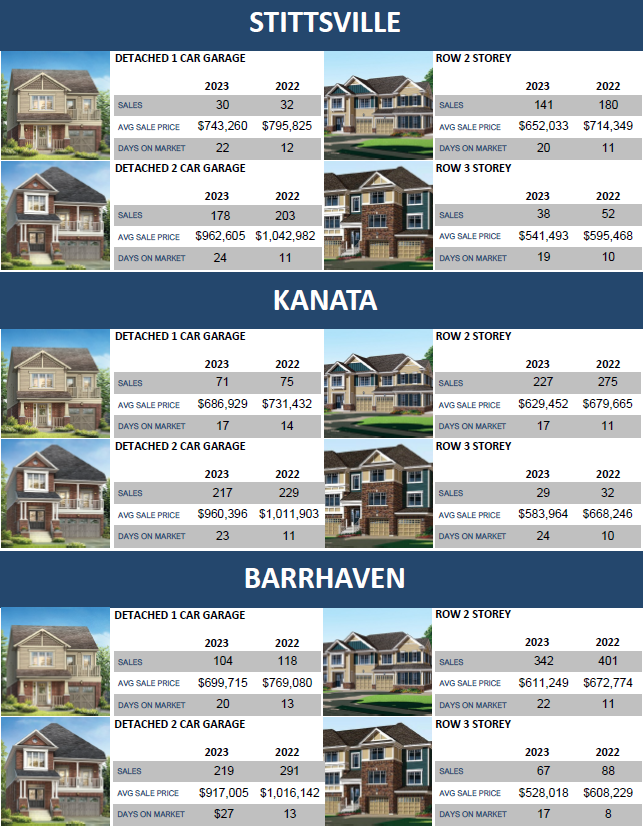
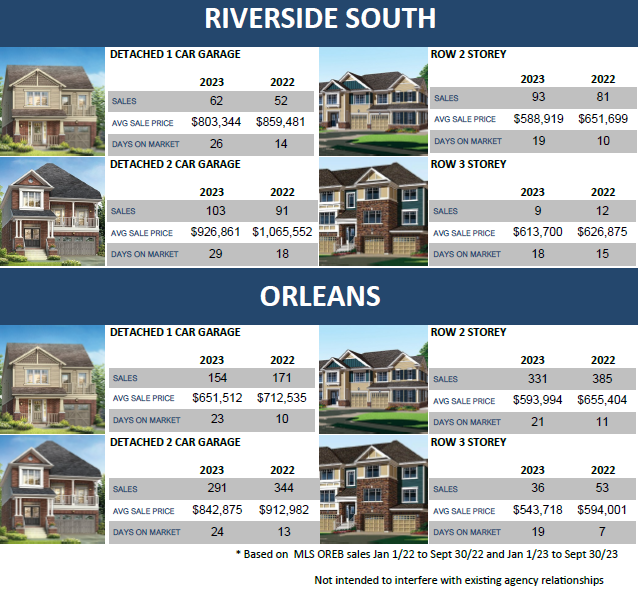
I think the word I would use to describe our real estate market is fluid. We are constantly changing as there is so much external pressure with interest rates and negative news coverage on house prices and the possibility of a bubble. Affordability is also a major factor for home buyers right now. The first-time homebuyer segment is very challenging as new buyers do not have equity that has accumulated over the past few years. They are using their savings and seeing the mortgage rates and payments increasing constantly. Prices are down month to month between July and August but have stabilized in the past few weeks as there seems to be some demand right now as the summer months are behind us and buyers & sellers want to get their real estate needs dealt with before the snow flies.
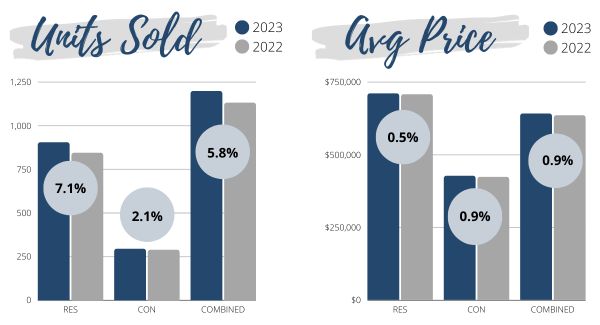

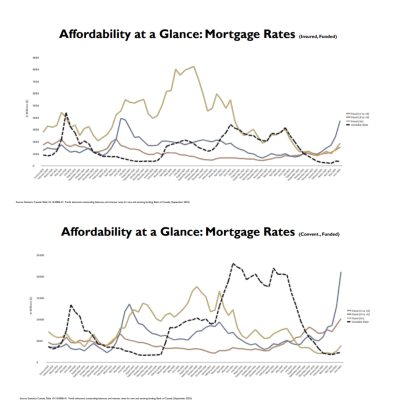
We also wanted to share some recent slides with you. Staying informed about the latest market trends, mortgage rates, and more is a priority for us, and we’re eager to keep you in the loop.
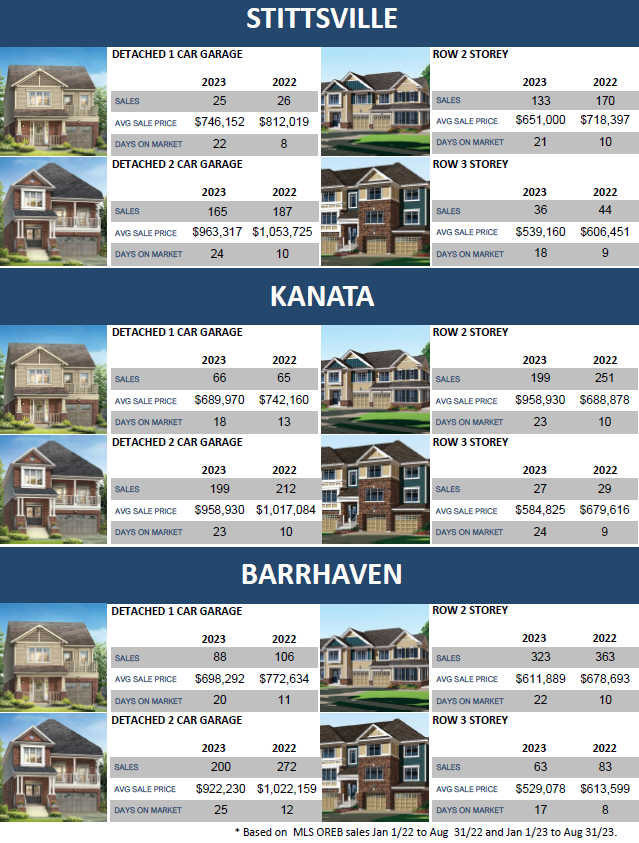
Here is the most recent installment of our new monthly value-added feature, the Suburban Statistics Series. This series showcases statistics for the 5 largest urban neighbourhoods in Ottawa.
As Ottawa is such a spread-out city it’s great to see the variances from area to area. All of these statistics are based on MLS OREB sales from January 1, 2022, to August 31, 2022, over January 1, 2023, to August 31, 2023.
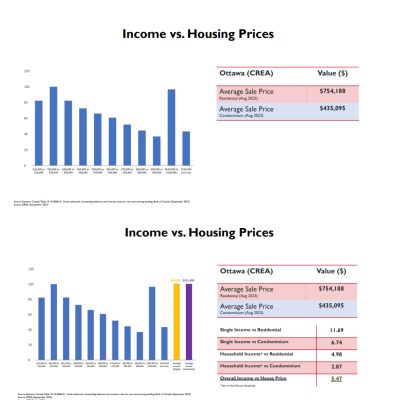
The real estate market is currently undergoing some fascinating changes. With two recent quarter-point interest rate hikes by the Bank of Canada, buyers are understandably feeling the pinch as prices rise. Interestingly the statistics reveal a more complex picture; sales are still strong, even outpacing the previous year and we are returning to a more balanced market.
Year-to-date, average prices for freehold properties are down by nine percent compared to last year. Yet, when we examine month-to-month data, we find that average purchase prices are increasing along with sales numbers. This year’s trajectory is mirroring the past, with a slow winter, active spring and summer, and now a more balanced market, depending on your location.
For prospective buyers, it’s important to resist short-term speculation. This market favors those who believe in the long-term potential of real estate, considering its historical performance and outlook. Additionally, there’s an interesting opportunity in multi-residential properties, which have seen prices drop due to rising interest rates. Investors have cooled on these properties, making it a potentially favorable time to invest.
As always if you’re curious about your specific neighborhood, don’t hesitate to contact us. We are always happy to help! Wishing everyone well, and take care!


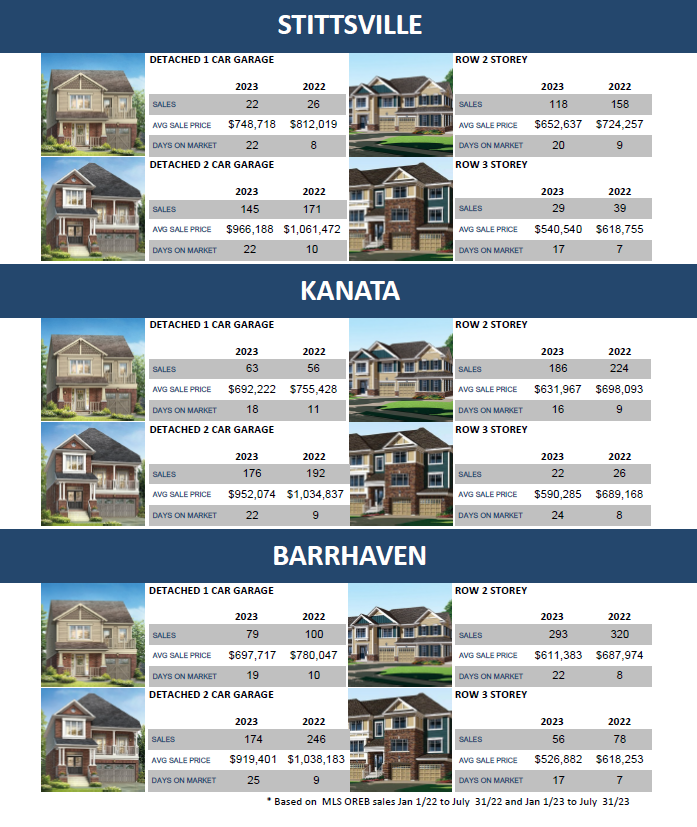
Here is the most recent installment of our new monthly value-added feature, the Suburban Statistics Series. This series showcases statistics for the 5 largest urban neighbourhoods in Ottawa.
As Ottawa is such a spread-out city it’s great to see the variances from area to area. All of these statistics are based on MLS OREB sales from January 1, 2022, to July 31, 2022, over January 1, 2023, to July 31, 2023.
Big news from the Bank of Canada today: interest rates have increased by a quarter percent. This puts the BOC rate to its highest spot since 2001. This will have an impact on buyers affordability in the market place. They are trying to cool this market and I believe this will do just that.
Buyers will now pay more for variable mortgages, making homes more expensive for the average buyer. Real estate prices seem to be holding stable but more inventory will be available and buyers will be more selective. This will be shifting us to a more balanced market sooner than anticipated. Prices are down about four percent compared to last year, with this new rate yet to be absorbed into the market. It will be interesting how things go from here. I really hope this is the last of the rate increases. I am not sure a forced recession is the best economic policy.
Stay informed about your neighborhood by reaching out for expert advice. Sellers face increased competition and need to stage and market their homes strategically, while buyers benefit from someone who knows the market and can negotiate effectively. We are always just a call or email away. Enjoy your summer everyone!


When it comes to the world of Ottawa real estate, stumbling upon an extraordinary property that captures everyone’s attention is a rare find. But every once in a while, a house emerges that captivates the market. Enter 5406 Mansel Crescent – a true masterpiece that has swiftly become our favorite listing. Working with the sellers to present this luxury home to the market was a wonderful experience.
In the realm of real estate, it’s not often that a property within a specific price range attracts multiple offers. Yet, 5406 Mansel Crescent has defied all expectations. The overwhelming interest from buyers and the fierce competition surrounding the offers validate the undeniable appeal of this remarkable house. The cost per square foot really set this home apart from the competition. They were able to secure a benchmark price for the area in large part due to its exceptional features and incredible design. The true magic of this house lies in the love and care invested in every single detail by the sellers. It is evident that they poured their hearts into creating a space that emanates warmth, elegance, and a genuine sense of home. From the thoughtfully curated finishes to the carefully considered design choices, every aspect of this house was taken into consideration.
During the listing process every detail was meticulously addressed, leaving no stone unturned. From the initial staging and photography to the comprehensive marketing strategy, we ensured that this home would shine among other listings in the area. We produced a great video making sure that all the best features of this home were presented to prospective buyers. Further, we live in a social media world. We had a second video professionally made with a drone intro for our Instagram reels. Both these videos were marketed to tens of thousands of buyers in our local market. The strategy was to blanket Ottawa on Instagram, Facebook, and youtube. It was amazing how many people came up to me to say they saw the video on one of those platforms. It was fun creating some serious buzz about this home.
As part of our marketing plan, we organized a broker open house, where we made sure to make it a memorable event. Champagne flowed, and refreshments from the local café, 692 Coffeehouse in Manotick, were served. The success of this event served as a true testament to the desirability of the property. The attending agents were not only impressed by the luxury home itself but also by the attention to detail and care put into its presentation. A few were influencers with thousands of followers on social media. They were taking videos and posting to their own followers. It was a really cool thing to see how a listing can go viral. All to say we had lots of fun working on this luxury listing and look forward to working in this niche in the future.